
The Super El Niño Mirage: What the Data Actually Says About 2026/27
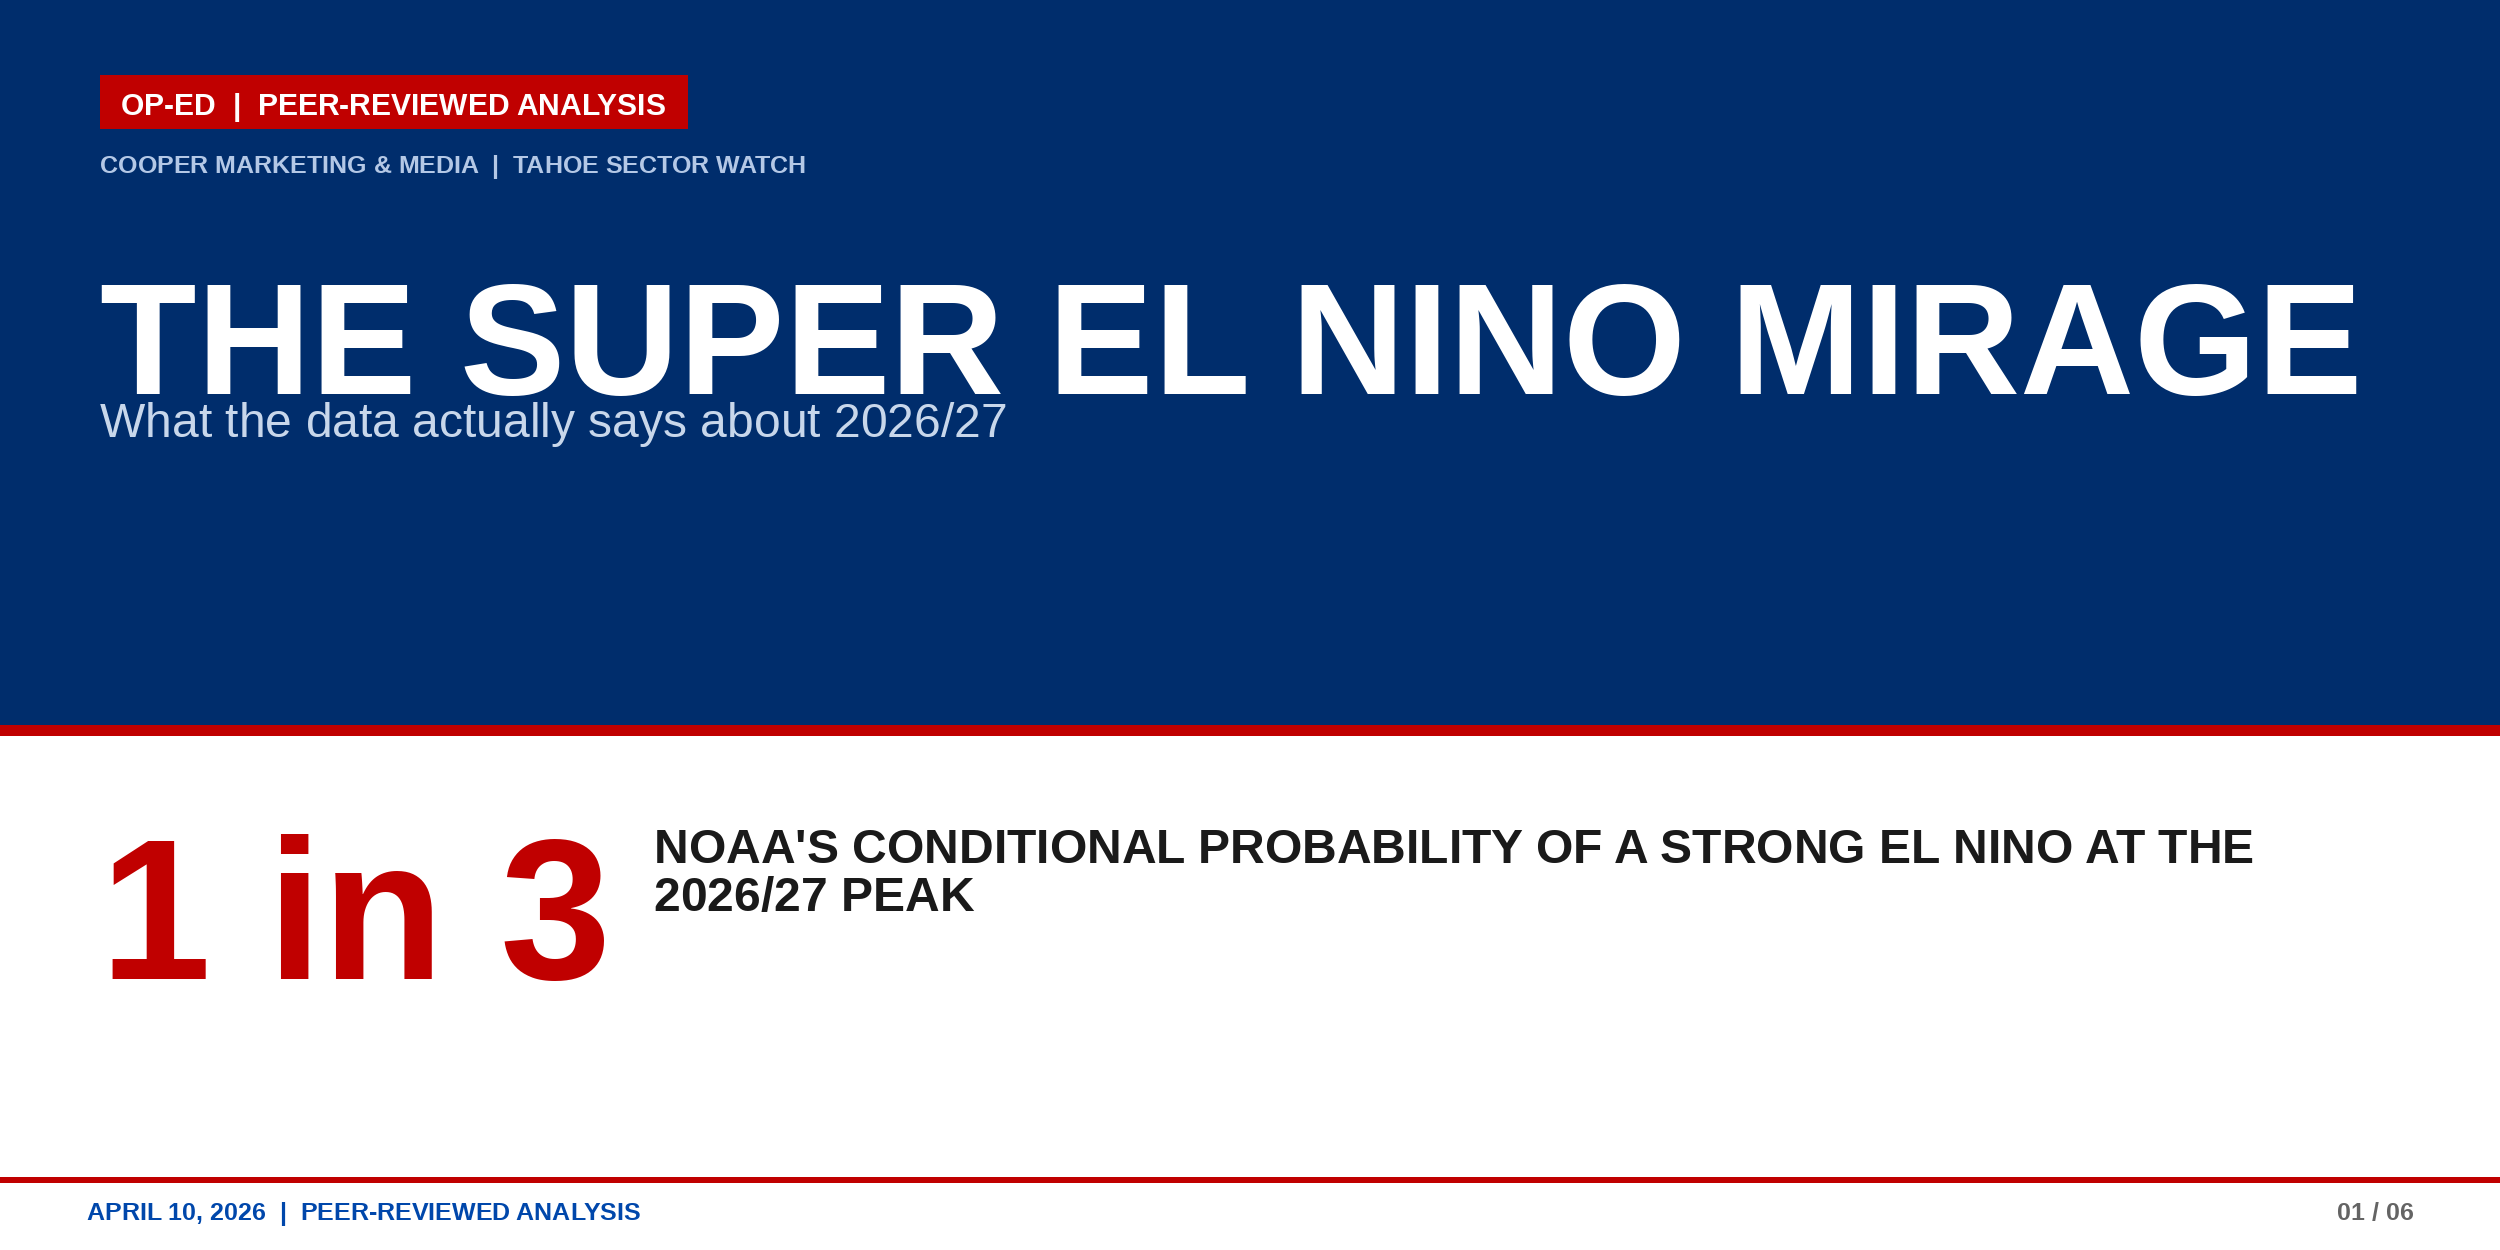
Notes from the ENSO casino on why everyone is reading the same model run, calling it a forecast, and selling it to a ski industry that cannot afford another bad bet
Around 6 a.m. on April 6, the wire services caught the scent, and the Great American Weather Hustle of 2026 was open for business. The Washington Post had it first. CNN by breakfast. Newsweek, The Hill, and forty weather blogs by lunch. By the time the sun cleared the Carson Range, every editor in the country was running the same three words: Super El Niño. Two capital letters and a tilde, stacked on top of a graph most of them had never actually read, pointed at a ski industry praying for a cold front and a credit line.
I read every one of those stories and pulled the model run they are all quoting. Before anybody burns another marketing dollar on a headline, walk the numbers the way you walk a hand of poker. What is the prior, what is the new evidence, what does the evidence actually move, and what is the probability the story the market is buying is the story that verifies? That is the Pinker move. The only move that works when the world is screaming and the data is whispering.
Punchline up front: the signal is real. The “Super” framing is not. The leap from “El Niño is probably developing” to “the Sierra is about to have a historic winter” is a leap the historical record does not support, not even in the years the headlines are citing as their reference class. I know because I pulled the reference class.
Four questions, answered in order, work shown, other side steelmanned at the end, and a probability distribution you can plan a fiscal year around.
Are we actually entering a Super El Niño cycle?
What data points are driving the media cycle, and how much weight do they actually carry?
What have prior Super El Niños actually produced at Tahoe, in the numbers and not the lore?
What is the honest probability, stated as a number, that this event matures into the winter the headlines are selling?
1. Where we actually are, in the boring language of the people who forecast this for a living
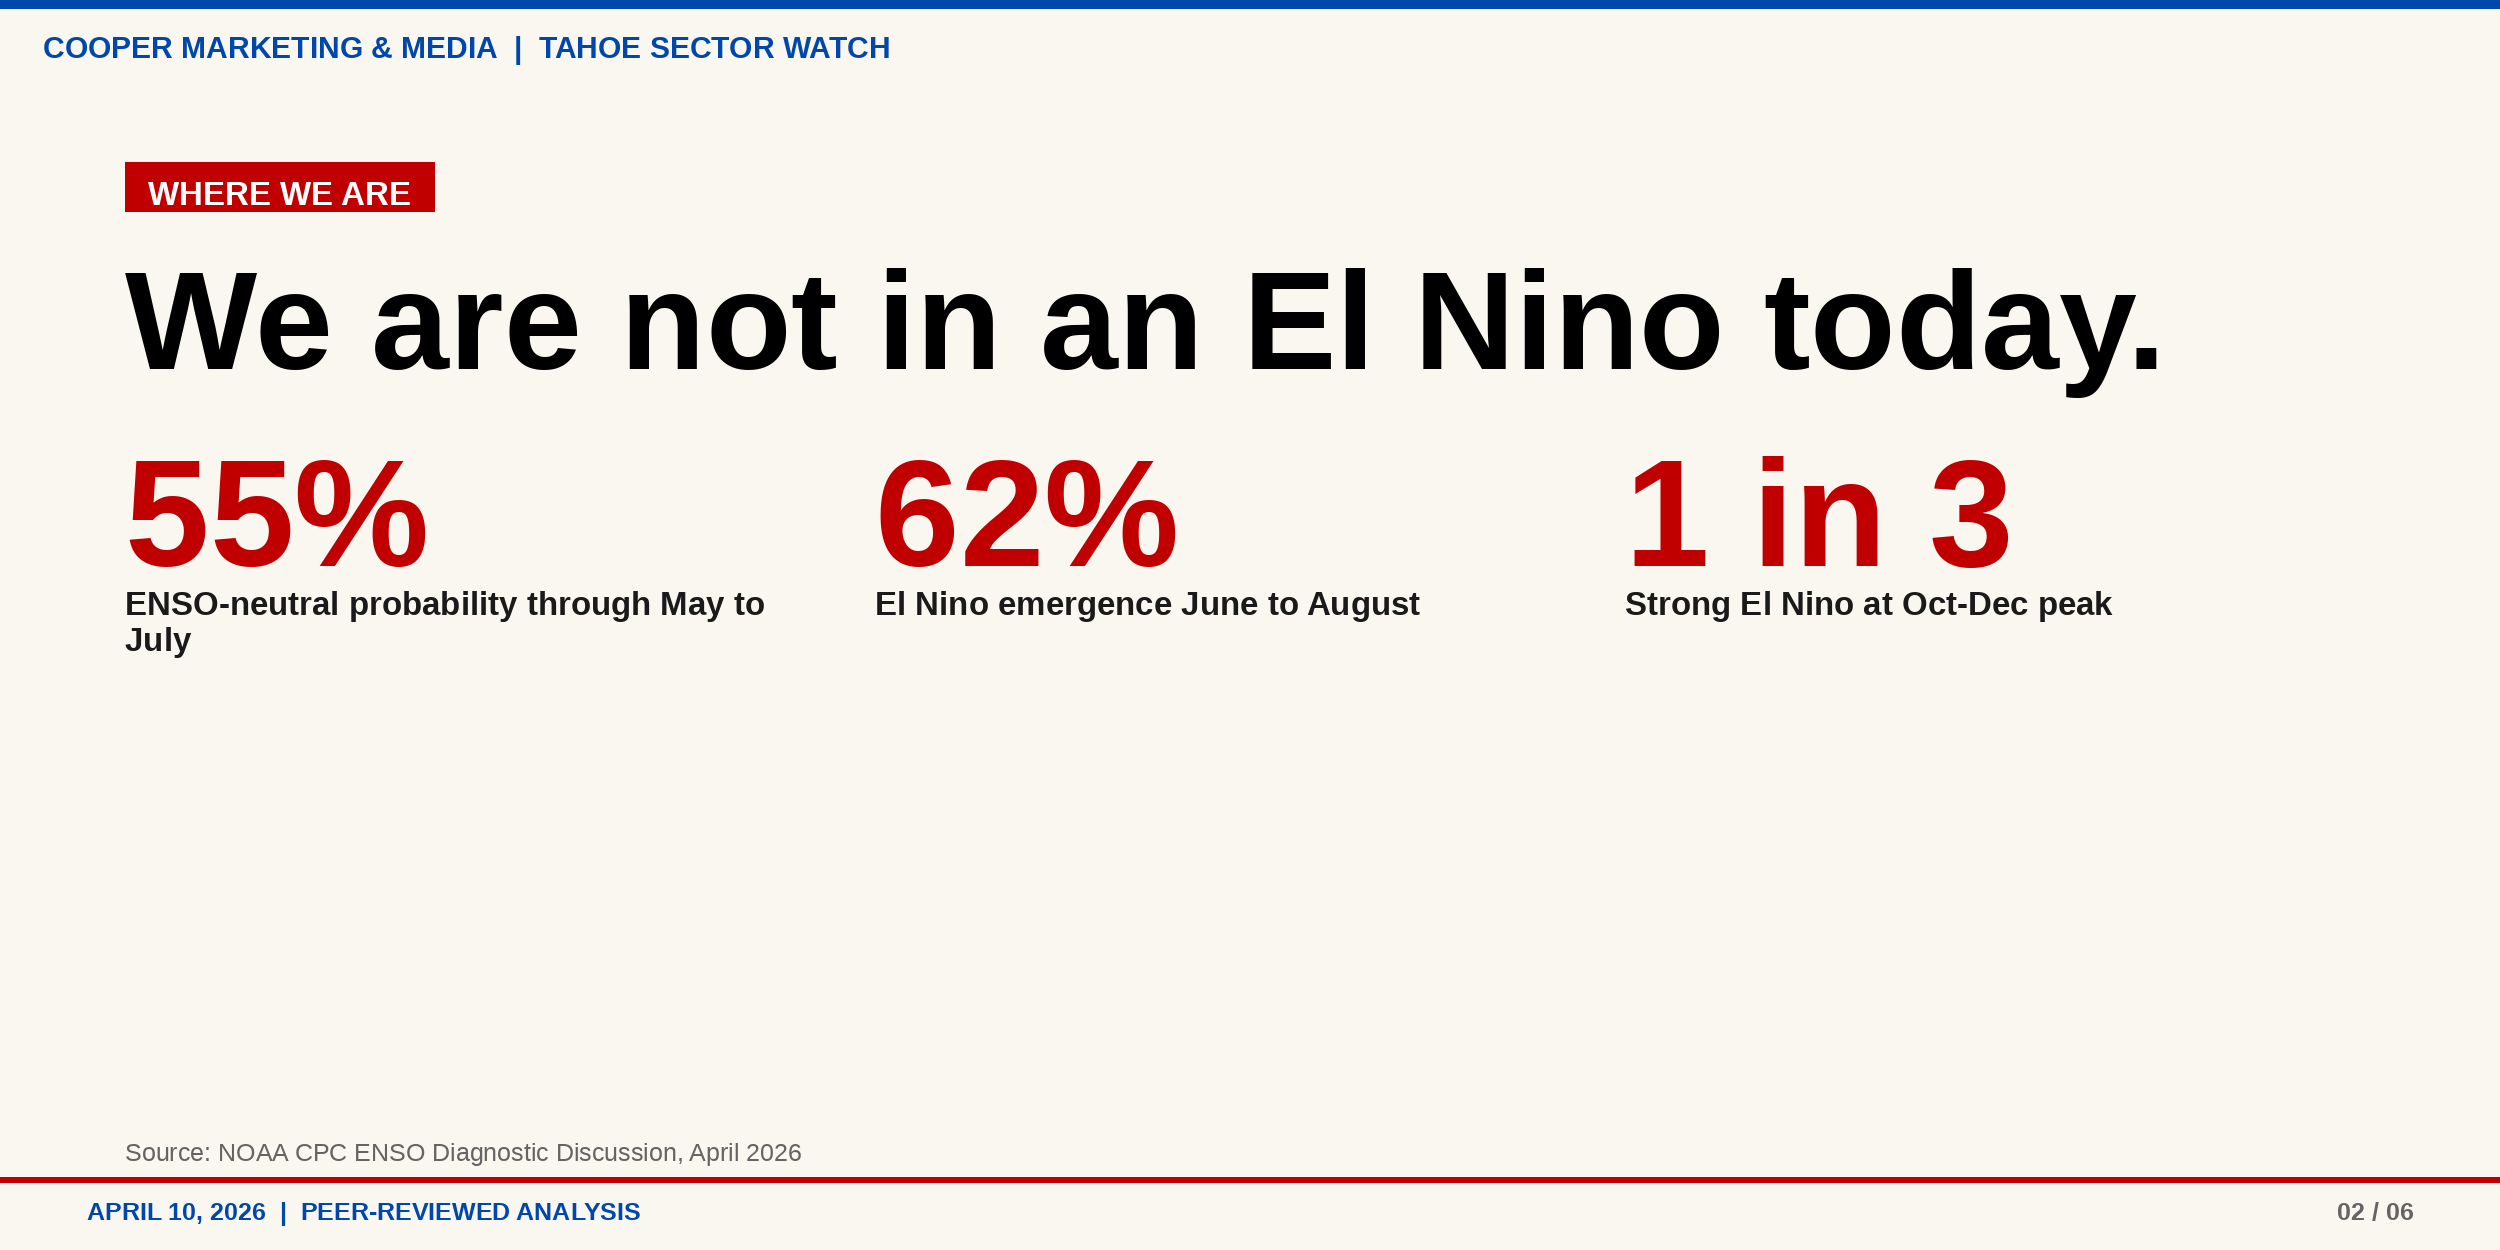
Start with the prior. Per the April 2026 NOAA CPC ENSO Diagnostic Discussion, the tropical Pacific is transitioning out of La Niña into ENSO-neutral. CPC puts neutral at 55 percent through May to July, with El Niño emergence at 62 percent for June to August, persisting through year-end. Read that twice. Then read this: we are not in an El Niño today. We are in the early weeks of neutral with a subsurface Kelvin wave quietly loading warm water eastward, and the trade winds starting to fold.
Now the fact the headline writers skipped. CPC assigns only a one in three chance that any El Niño that does form reaches “strong” (Niño 3.4 at or above +1.5°C) at its October to December peak. One in three. Not “Super.” Not “historic.” That is almost exactly the base rate once any El Niño is on the table. The federal agency whose full-time job is forecasting this ocean is telling you the current posterior is an ordinary El Niño with no unusual tilt toward the tail.
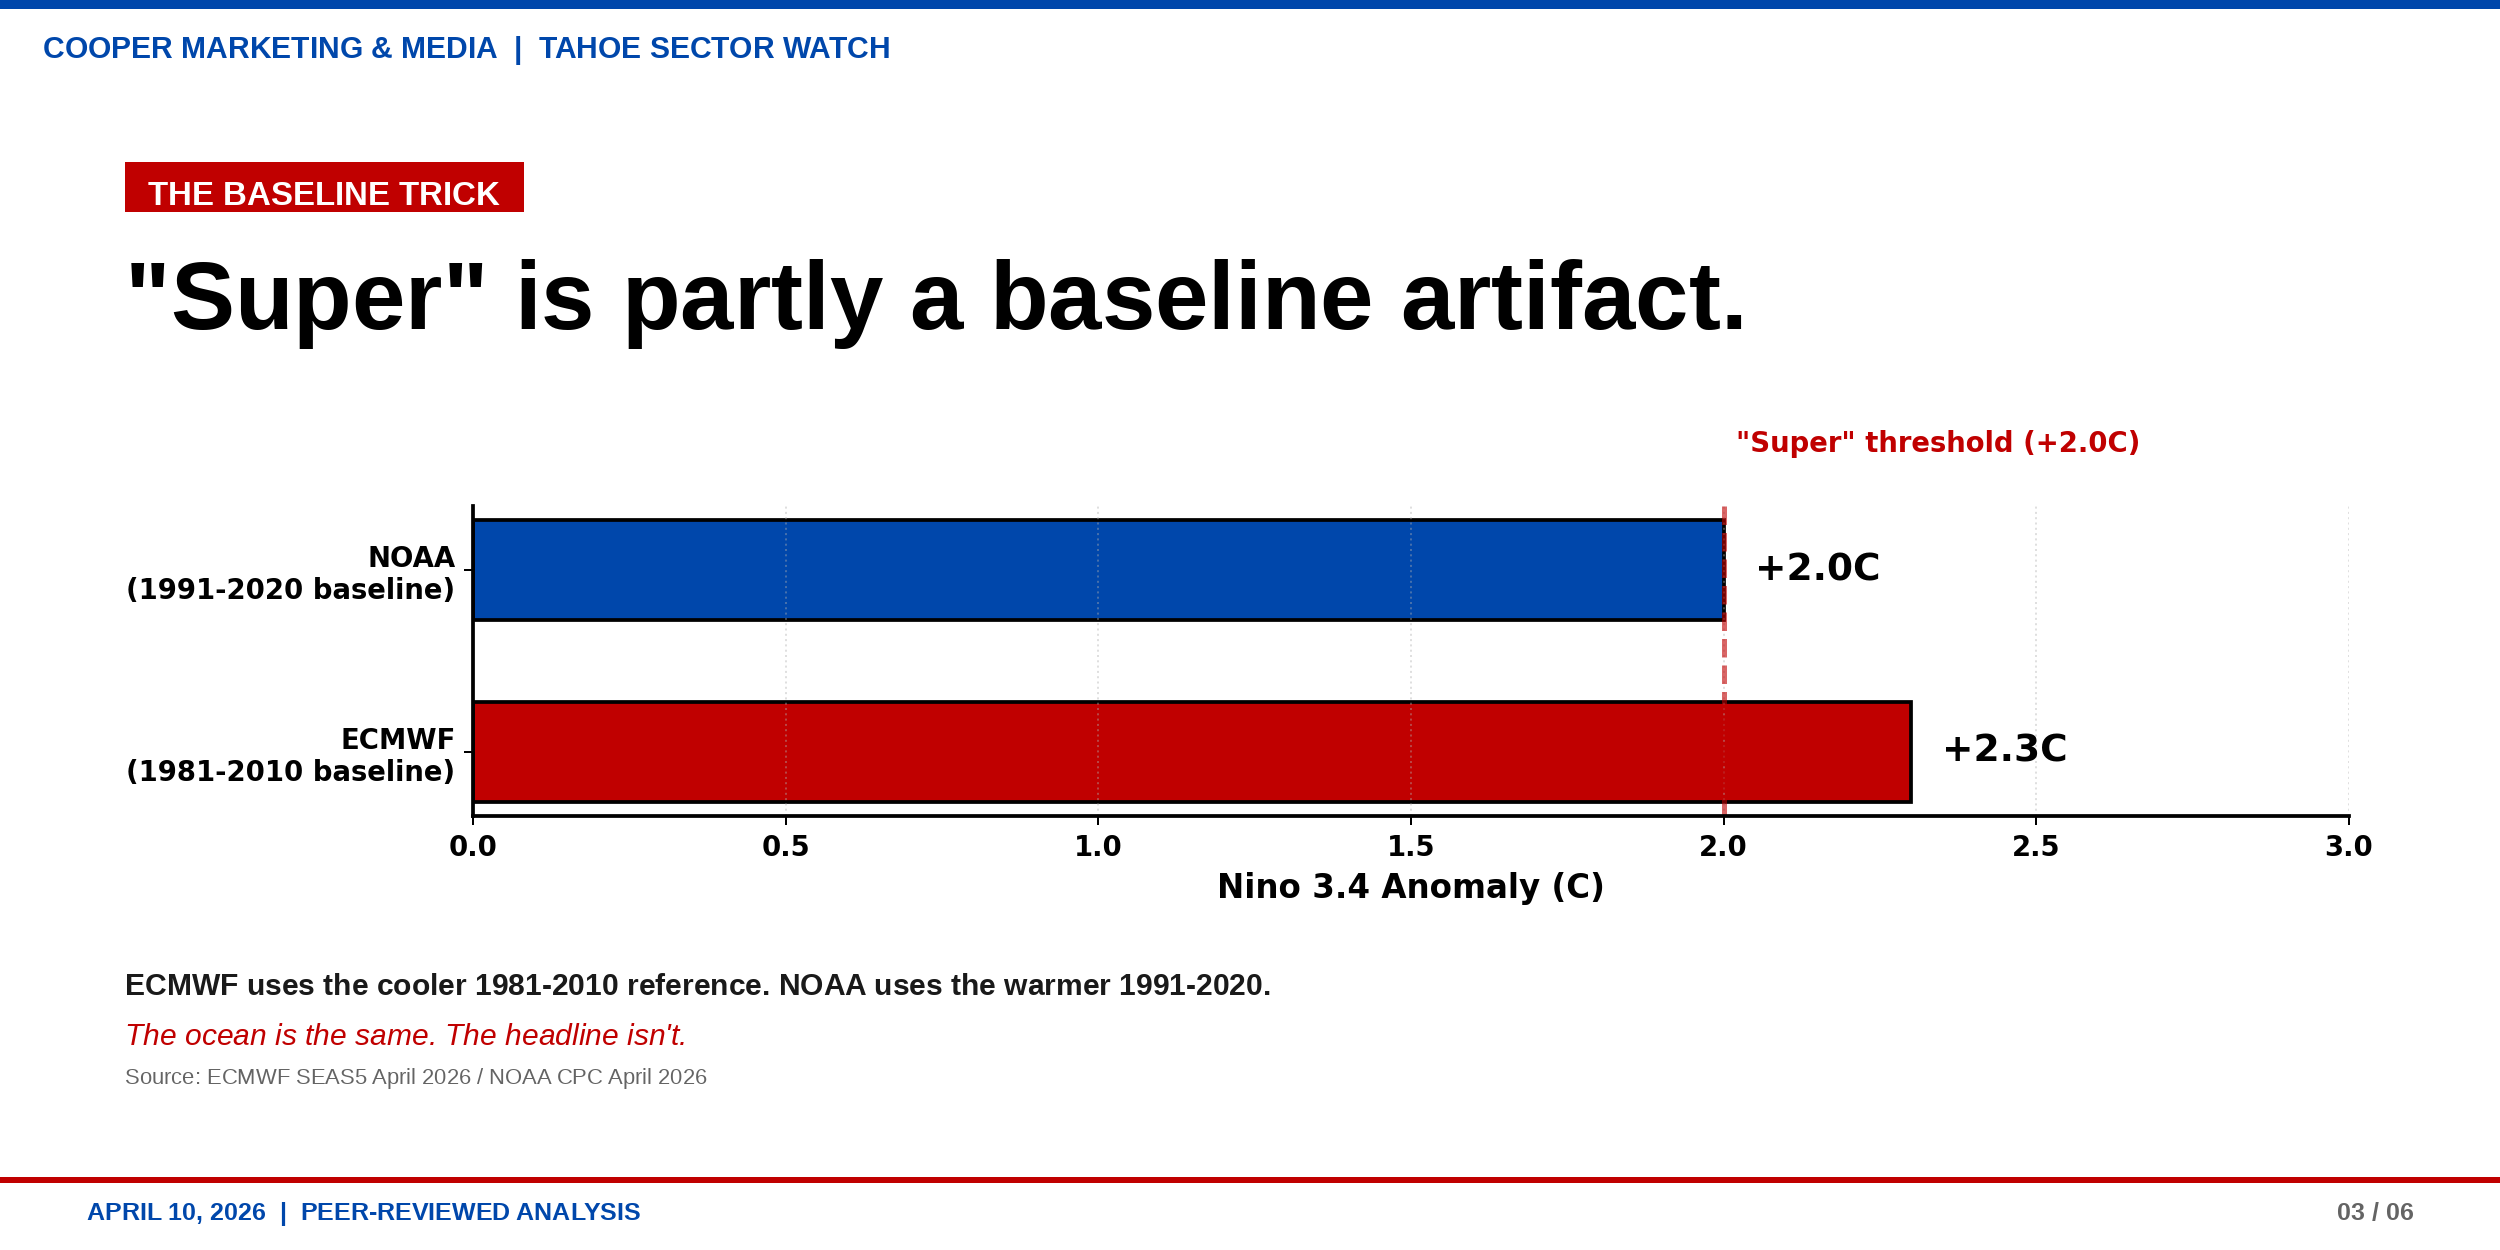
So where is the “Super” coming from? Almost exactly one place: the April 2026 ECMWF SEAS5 ensemble, whose plume has tightened hard this month, with a substantial fraction of members above +2.5°C Niño 3.4 by October. Eye-catching. It is why the story exists. It also has three asterisks stapled to it, and the national press has not printed one.
2. The data points driving the story, and the asterisks the headlines forgot
The case for a Super El Niño rests on three pillars. Each is defensible on its own. None of them, taken together, add up to the certainty the headlines imply. A fourth factor cuts the other way and is the single most important thing anyone making a decision today needs to internalize.
Pillar one: the ECMWF ensemble. The April 2026 SEAS5 plume is the most aggressive seasonal outlook of any operational center, with roughly half its members above the +2.0°C “Super” threshold by October. Now the asterisk the Washington Post did not print. ECMWF still computes anomalies against the 1981 to 2010 baseline. NOAA uses the warmer 1991 to 2020 baseline. That single choice inflates ECMWF anomalies by roughly 0.2 to 0.3°C relative to NOAA. A +2.3°C ECMWF forecast and a +2.0°C NOAA forecast are, in the physical ocean, the same forecast. The word “Super” is being generated, in part, by an accounting decision. Not a conspiracy. A footnote nobody read.
Pillars two and three: subsurface heat content and westerly wind bursts. There is an unusually large volume of warm water stacked below the thermocline in the central and eastern equatorial Pacific, and ENSO specialist Paul Roundy has flagged spring wind anomalies rivaling 1997. Both observations are accurate. The asterisk: subsurface loading is a necessary condition, not a sufficient one. 2014 had a comparable signature and produced the “El Niño that wasn’t.” The ocean is primed. Whether the atmosphere couples to it is a separate coin flip.
The fourth factor, the one nobody is mentioning: the spring predictability barrier. April and May are the two months of the year when ENSO forecast skill is at its statistical low point, by a wide margin. State-of-the-art models explain less than a third of observed ENSO variability in the May to July window. Correlation skill drops to roughly 0.76 at an April initialization and 0.73 by May. A Super El Niño forecast issued in April is a forecast made at the single worst moment of the year to make it. Anyone reporting it as a done deal is either new to this or selling something.
“A Super El Niño forecast issued in April is a forecast made at the single worst moment of the year to make it. That does not make it wrong. It makes it the forecast equivalent of calling a seven-game series after Game 1.”
3. What the last three Super El Niños actually handed the Sierra, in the numbers and not the lore
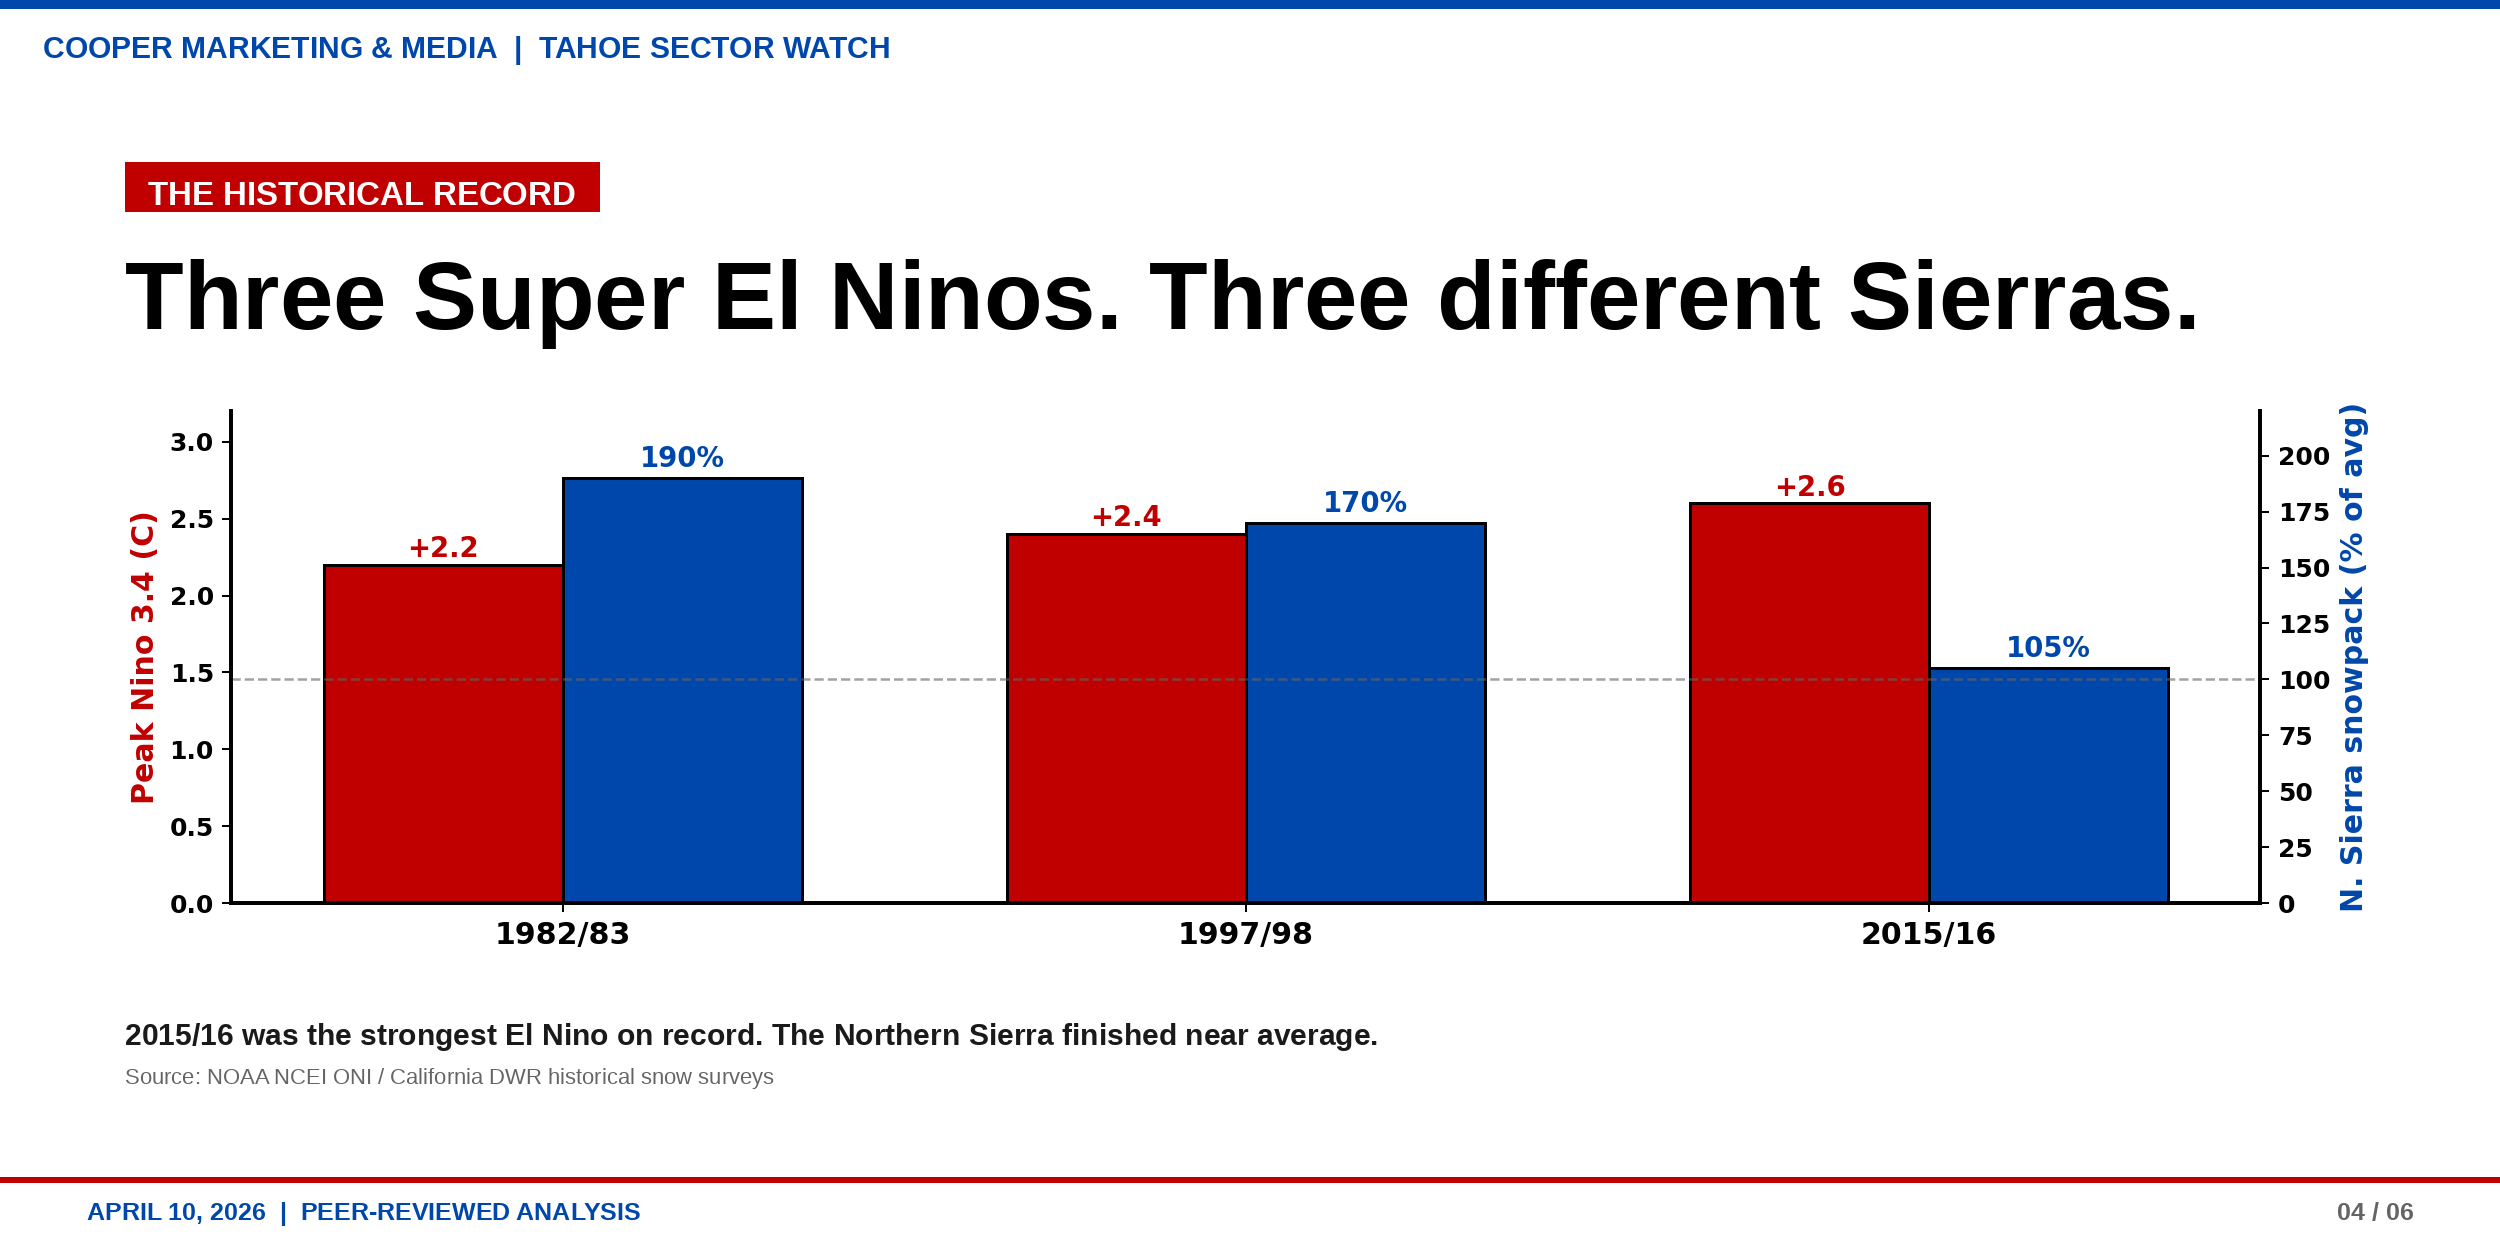
Now, the reference class the headlines keep gesturing at without showing. The modern record contains three events the climate community agrees to call Super: 1982/83 at +2.2°C, 1997/98 at +2.4°C, and 2015/16 at +2.6°C. This week’s coverage is telling the ski industry to expect a winter that resembles the first two and forget the third. That is not how reference classes work. You get all three, equal weight.
Weight them equally and the results are stranger than the lore. 1982/83: one of the wettest, snowiest winters in Sierra history. Legendary. 1997/98: finished well above average. Good winter. Then 2015/16, the strongest Niño 3.4 event ever instrumented, produced a Northern Sierra snowpack that finished near average, a Southern Sierra below average, and one of the driest Pacific Northwest winters of the decade. The biggest Niño we ever measured produced a Tahoe season that was, charitably, fine.
The peer-reviewed correlation literature tells the same story. Jan Null’s California El Niño climatology and Tony Crocker’s MEI versus snowfall dataset both find that the correlation between Niño 3.4 magnitude and seasonal Tahoe snowfall is surprisingly small, small enough that two strong El Niños (1986/87 and 1991/92) were drought years at Tahoe. That is a scatter plot, not an opinion.
Defensible summary: Super El Niños reliably shift the storm track south across the Southwest, Southern California, and the Southern Sierra. They do not reliably produce a great winter at Tahoe, Mammoth, or any resort north of I-80. Tahoe sits on the pivot point of the El Niño dipole. Which side the jet ends up on is determined by the MJO, PDO phase, QBO, and the position of the subtropical ridge, none of which are captured in the Niño 3.4 number driving every headline this week.
4. The honest probability, stated as a number you can actually underwrite
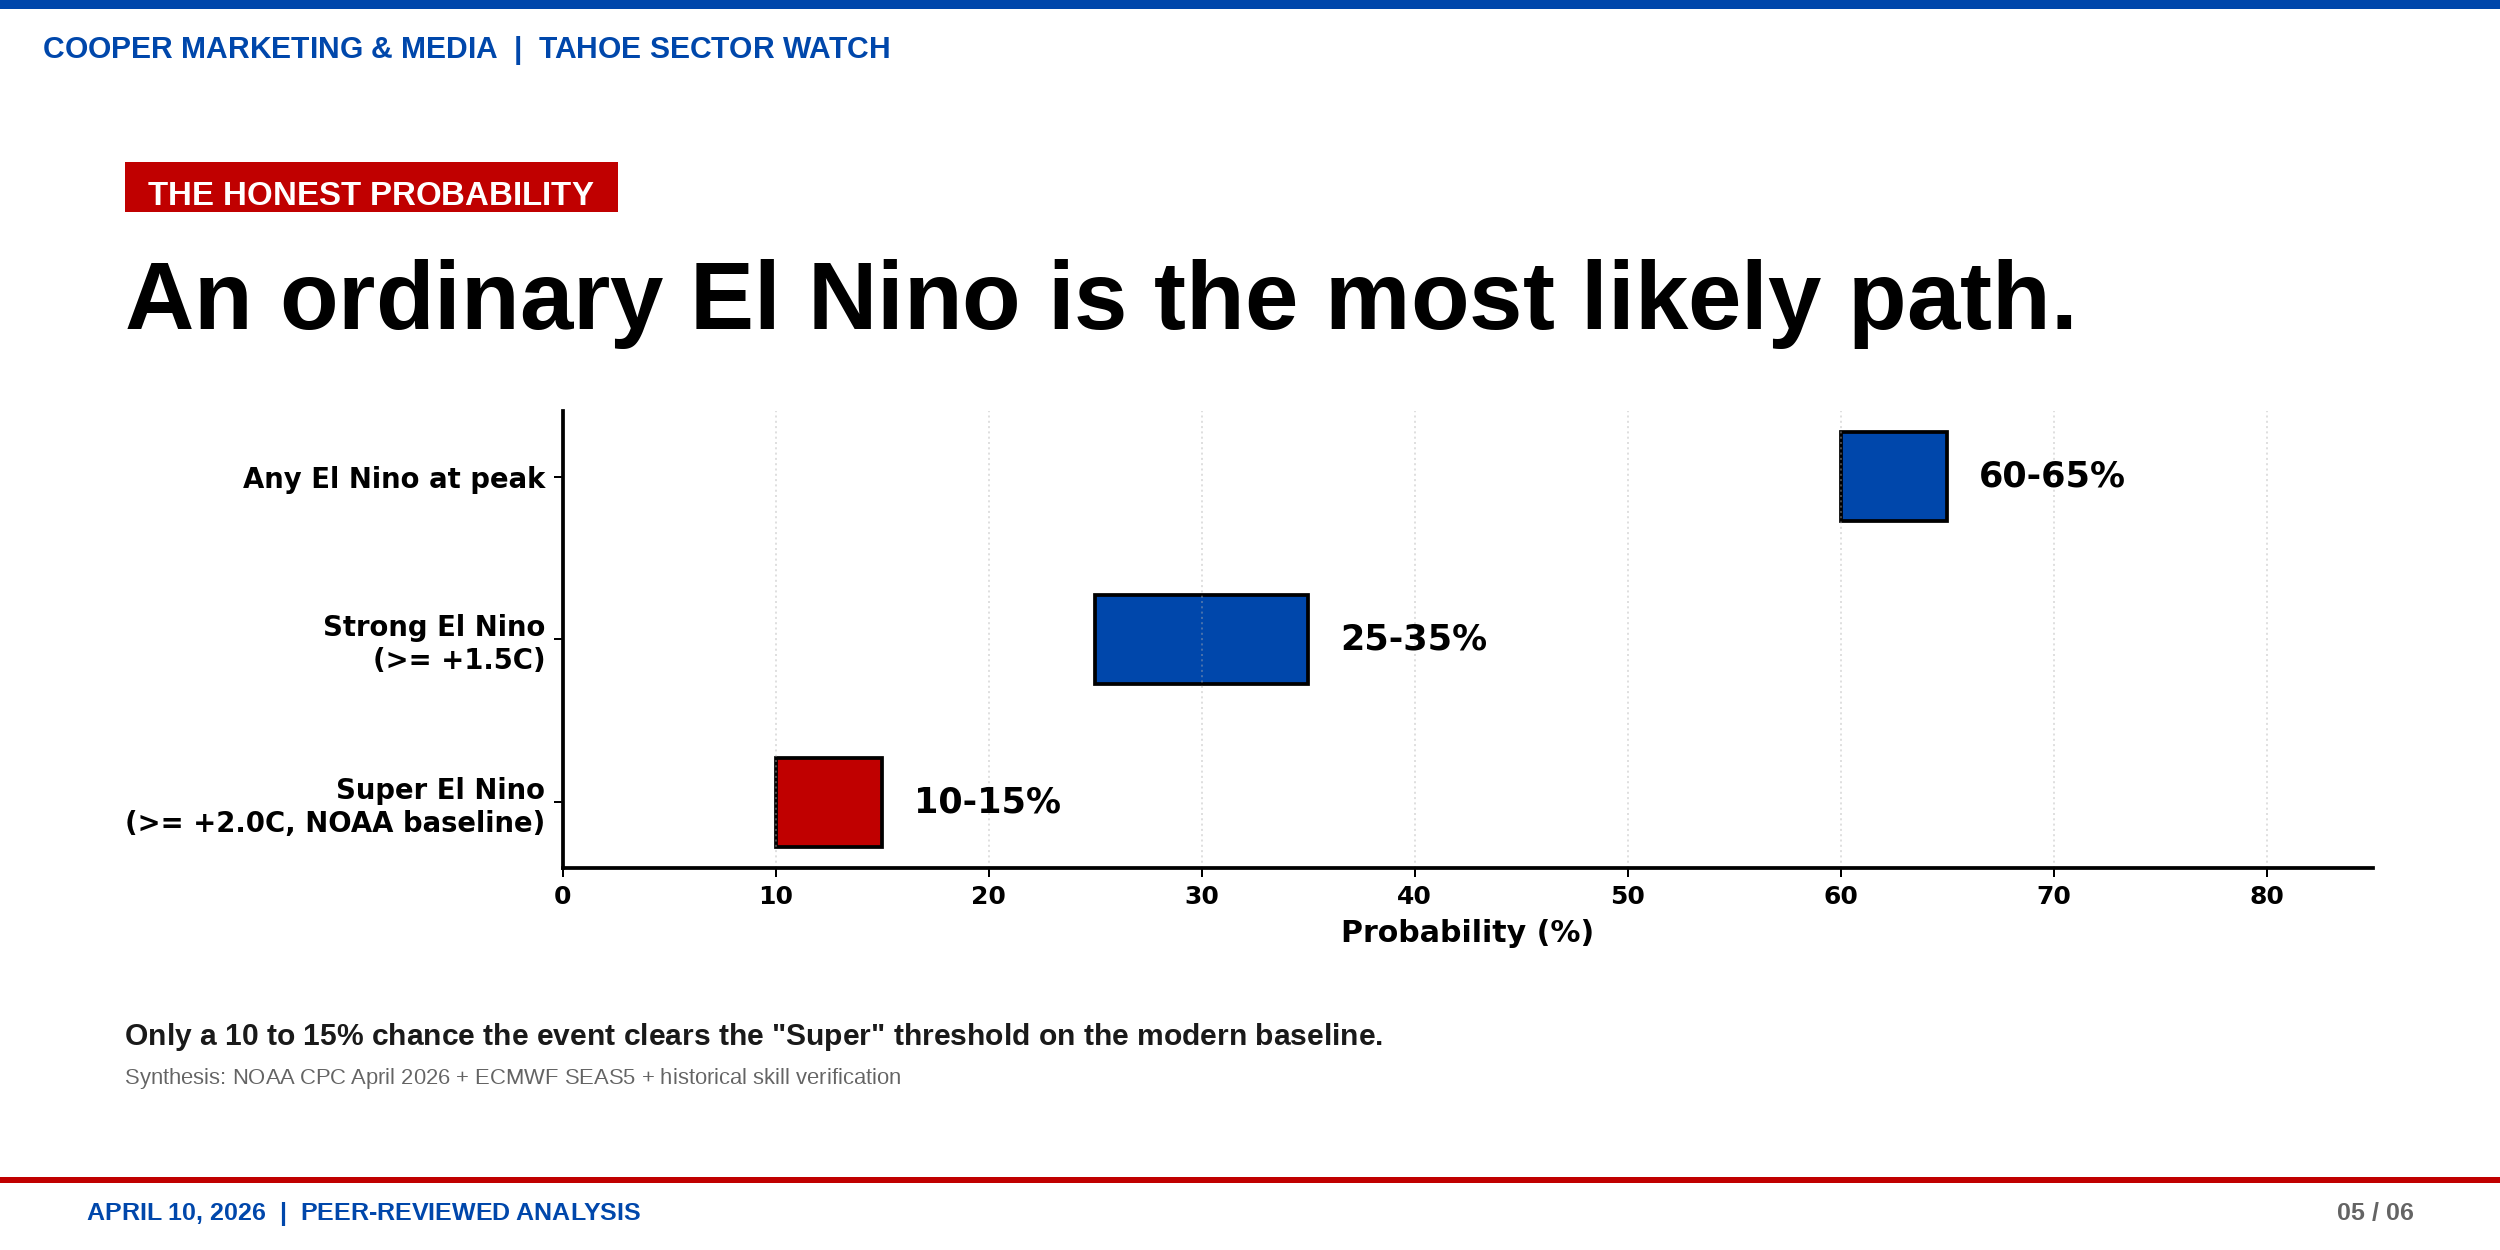
Time to do the thing the press almost never does and put a number on it. Synthesize the CPC discussion, the ECMWF plume, the historical composite, and the published limits of spring ENSO forecast skill, and the defensible distribution for 2026/27 looks roughly like this.
60 to 65 percent: an El Niño of some description is in place at the Oct to Dec peak.
25 to 35 percent: that event reaches “strong” (Niño 3.4 at or above +1.5°C) by the CPC definition.
10 to 15 percent: it actually clears the +2.0°C “Super” threshold against the modern baseline.
Those ranges are not hand-waving. They come out of CPC’s probability tables, tempered by the published skill of April initialized seasonal models and cross checked against the historical composite. They sharpen in June and July once the spring barrier lifts. They should not be treated as sharp today.
For the ski industry, the implications flip the media narrative. The most likely scenario is an ordinary El Niño, not a historic one, and an ordinary El Niño is not a guarantee of a great Sierra winter. It is a modest tilt toward a wetter Southern Sierra and a drier Pacific Northwest, with Tahoe dead center in the uncertainty band. Planning 2026/27 around a headline, “Super El Niño” or “El Niño bust,” is a mistake this industry has made twice in living memory.
The smarter play between now and the first real storm is to watch three things and ignore everything else. The May, June, and July CPC discussions, when the spring barrier lifts. Niño 3.4 against the modern 1991 to 2020 baseline, not the 1981 to 2010 reference, inflating the ECMWF charts. And the subtropical ridge and PDO phase in the fall, which decide which side of the pivot Tahoe lands on.
The steelman, because I owe the other side one
In fairness to the forecasters quoted this week, and there are good ones in there, the ECMWF signal is unusual for April, and the subsurface loading is impressive. If the April plume verifies, we are looking at a top-five ENSO event and a meaningful global climate story regardless of what happens in the Sierra. This piece is not an argument against taking El Niño seriously. It is an argument against compressing a probabilistic, spring barrier-limited forecast into a deterministic winter prediction eight months out and selling it to an industry that will make real capital decisions on the back of it.

The responsible forecast, as of April 10, 2026, the one I will put my name on: El Niño is the most likely path. “Super” is a reach. The Sierra is a coin flip even if “Super” verifies. Anyone telling you otherwise is selling you a headline, not a forecast. I will be at the May CPC release with a sharper number. Until then, keep your powder dry and your baselines straight.
Stay’nThirsty for POW
Coop | RS#69
SOURCES & METHODOLOGY
This op-ed was built from primary agency sources and peer-reviewed literature. Probability ranges are derived from the April 2026 NOAA CPC ENSO Diagnostic Discussion, the April 2026 ECMWF SEAS5 Niño plume, and published ENSO forecast skill verification. Historical Niño 3.4 peak values are from NOAA NCEI. California snowpack figures are from the California Department of Water Resources April 1, 2026 snow survey release. Sierra correlation analysis draws on Jan Null’s California El Niño climatology and Tony Crocker’s MEI-versus-snowfall dataset.