
The Conveyor Belt Is Skipping
An AMOC update, written with rationality and compassion.
I. Dispatch from 26 North
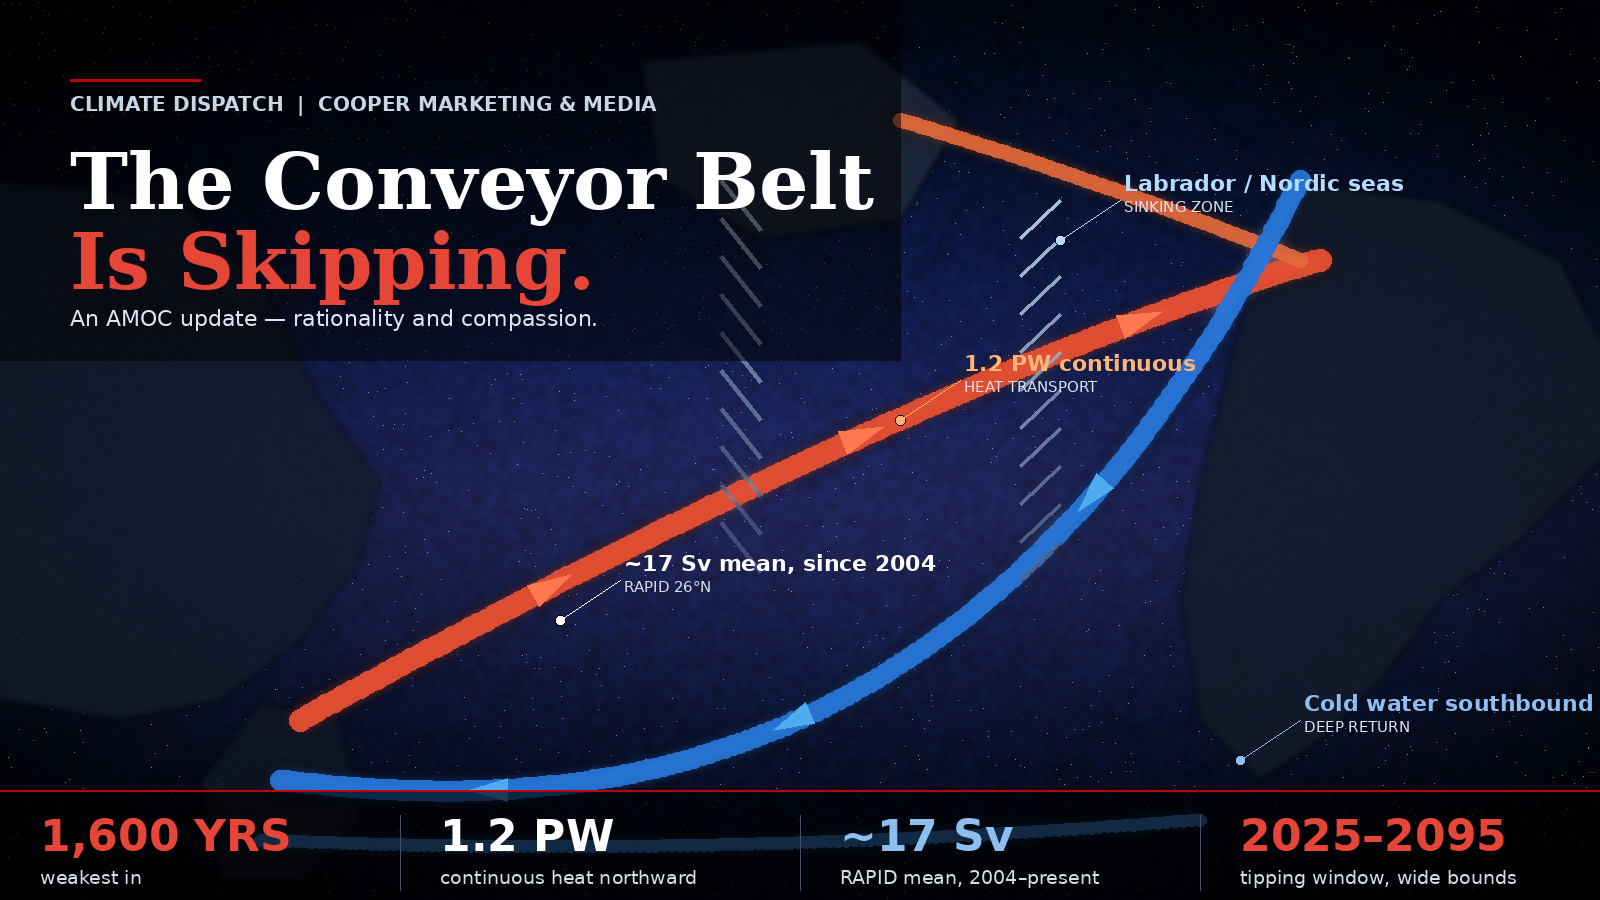
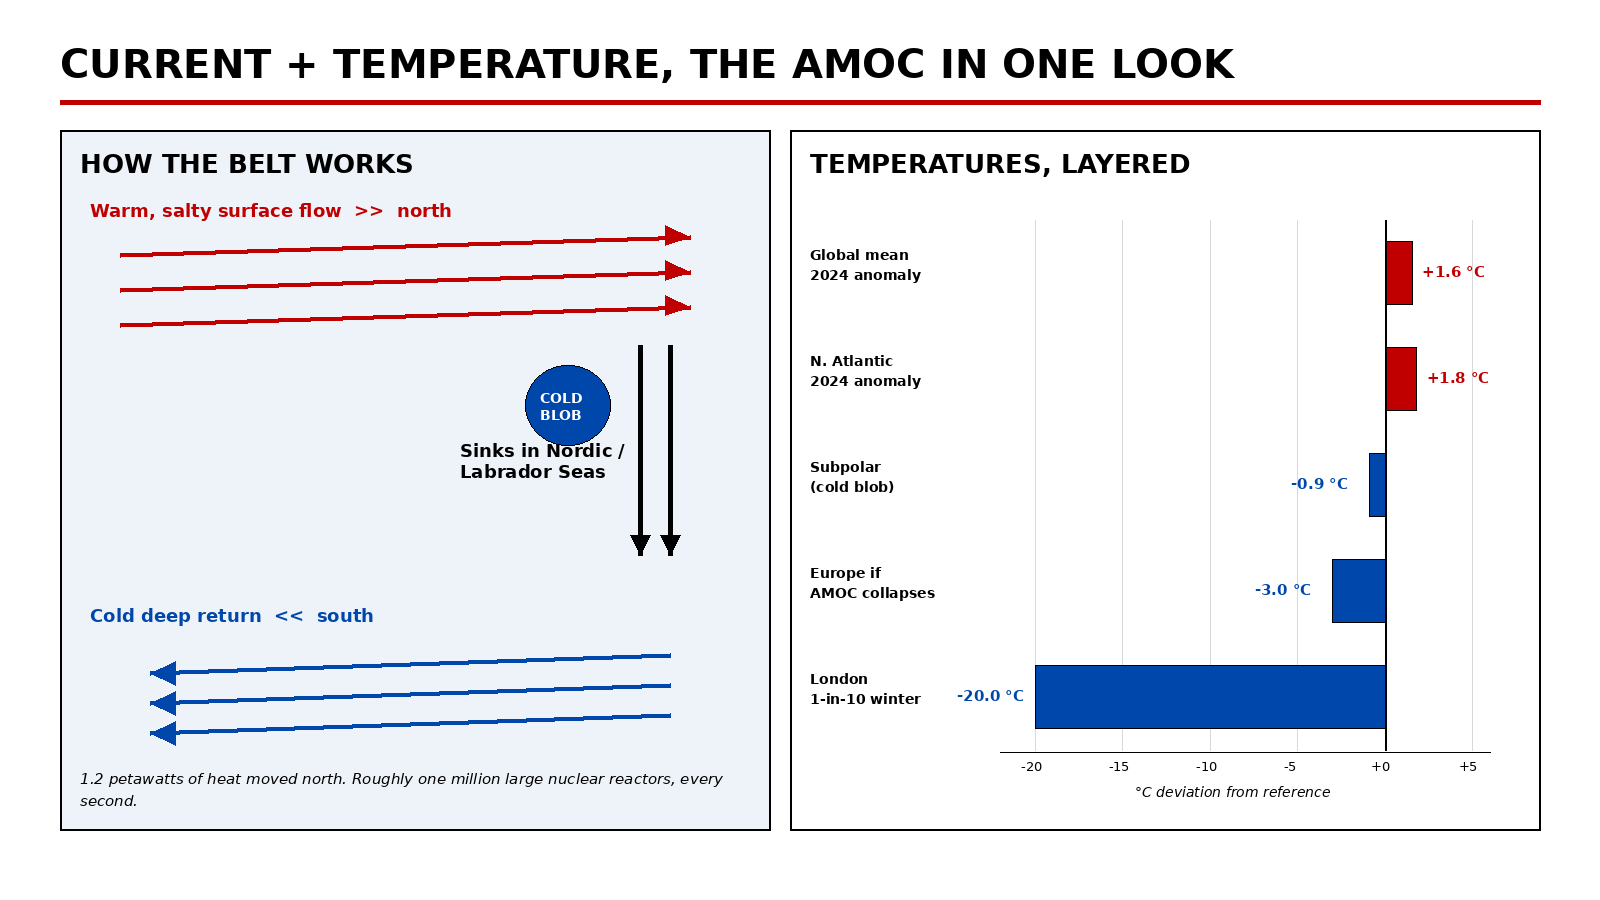
Somewhere south of Bermuda, a line of moored instruments has been listening to the ocean for twenty-two years. The array is called RAPID-MOCHA. It measures the Atlantic Meridional Overturning Circulation, a planetary-scale plumbing system that moves warm surface water north, cools it, sinks it, and sends cold deep water back south. This circulation carries roughly 1.2 petawatts of heat toward the North Atlantic. For reference, that is continuous power, not energy per second. One petawatt is one quadrillion watts, roughly the output of one million large thermal power plants running nonstop.
The array says the belt is slowing. Not catastrophically this morning. Measurably. Persistently. And, according to a new line of peer-reviewed work, with rising odds that the slowdown tips into something far worse inside the lifetimes of people reading this.
This is the update to our earlier Super El Niño dispatch. Same ocean. Different alarm.
II. The Numbers, Because Pinker Is Watching
THE RATIONAL CASE. SHORT, COLD, SOURCED.
Fact one. Caesar et al. (2021), using 1,600 years of proxy data (tree rings, ice cores, sediment, coral, ship logs), concluded the AMOC has weakened by roughly 15 percent, about 3 Sverdrups, since 1950, placing it at its weakest in the proxy record (Nature Geoscience).
Fact two. The RAPID-MOCHA array at 26 north has measured actual transport continuously since 2004. The trend is down at roughly 0.46 Sverdrups per decade. Twenty years of direct observation now corroborate the proxies (RAPID).
Fact three. Ditlevsen and Ditlevsen (2023) applied critical-slowing-down statistics (rising variance and autocorrelation, classic early-warning indicators from dynamical systems theory) to 150 years of subpolar sea-surface temperature. Their result: a likely AMOC collapse between 2025 and 2095, central estimate 2057, 95 percent confidence (Nature Communications).
II. The Numbers, Without Drama
Apply a rationality test. Strip the adjectives. Look at what the instruments say.
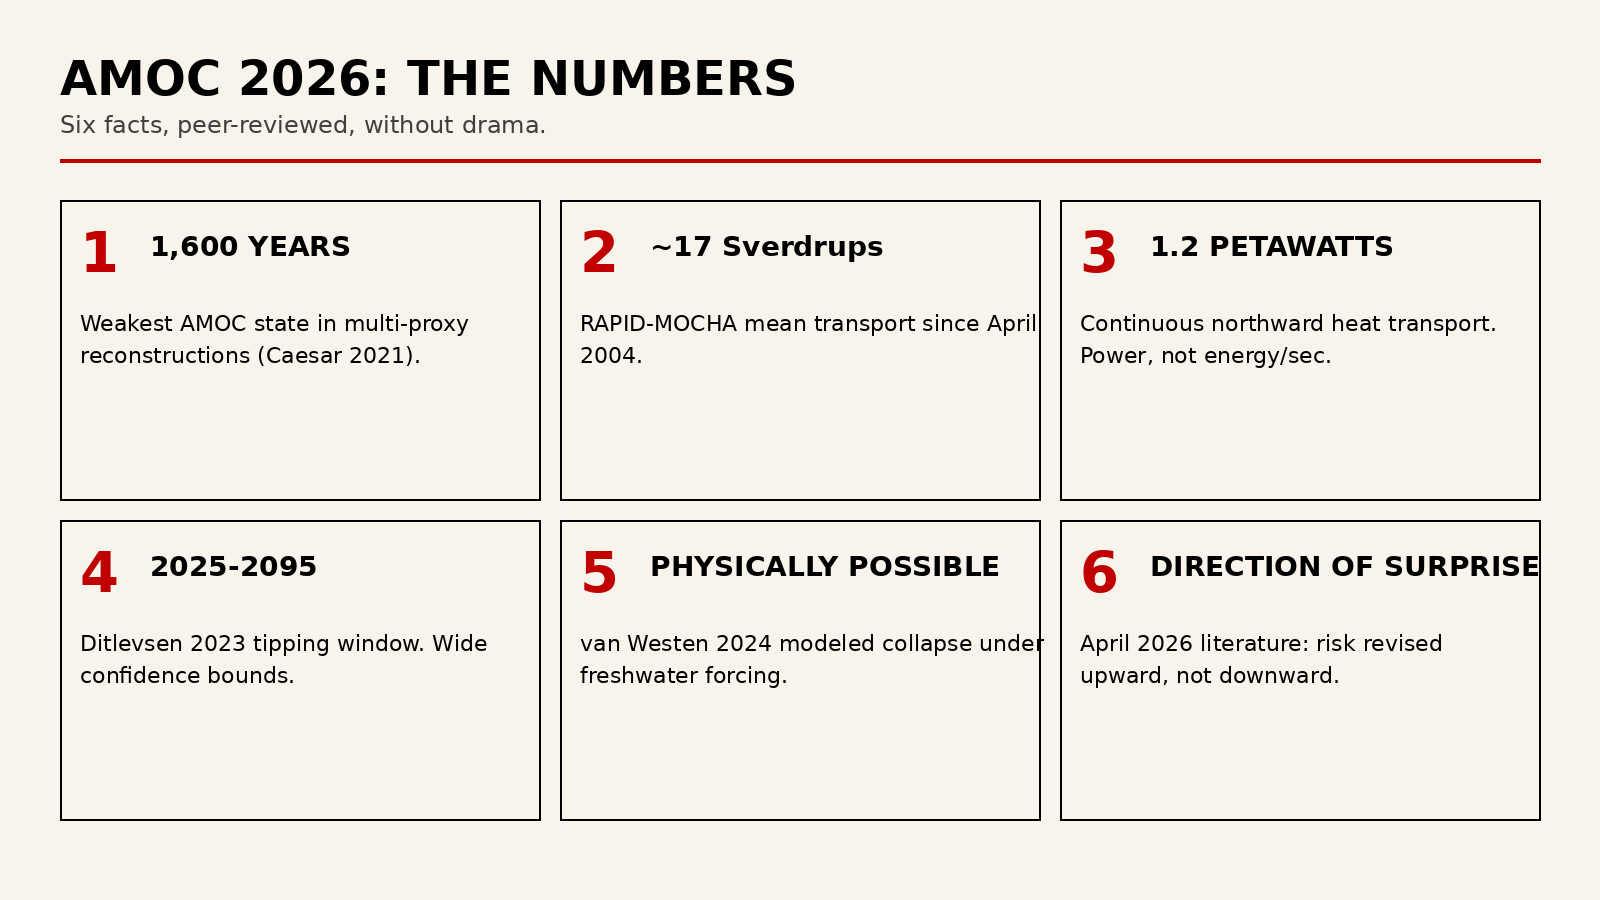
The AMOC is at its weakest in approximately 1,600 years, based on multi-proxy reconstructions from sediment cores, corals, and ice. That finding is not one paper. It is a convergence of independent reconstructions, anchored by Caesar and colleagues in Nature Geoscience (2021).
Direct measurement from the RAPID array at 26 degrees North has run continuously since April 2004. Over that window the mean transport is near 17 Sverdrups, with a measured decline on the order of a few Sverdrups across the record. One Sverdrup equals one million cubic meters of water per second, so every unit lost is a river system of heat no longer moving north.
A 2023 analysis by Ditlevsen and Ditlevsen, using early-warning statistical signals in sea surface temperature, estimated a central tipping window for AMOC collapse between 2025 and 2095, with a best estimate near mid-century. The authors were explicit that this is a statistical projection with wide confidence bounds, not a forecast of a specific year.
A 2024 modeling study by van Westen, Kliphuis, and Dijkstra demonstrated, in a state-of-the-art climate model, that AMOC collapse is physically possible under continued freshwater forcing and that existing early-warning indicators can detect the approach.
And the signal in 2026 has not improved. A Guardian report dated April 15, 2026, summarized new work arguing that AMOC collapse is significantly more likely than previously thought. Read carefully: the direction of scientific surprise, across multiple independent groups, is toward higher risk, not lower. That directional consistency is the part that matters most.
"The AMOC has been weakening. The peer-reviewed literature since 2021 has moved, on balance, toward higher estimated collapse risk, not lower."
— Summary of Caesar 2021, Ditlevsen 2023, van Westen 2024
III. The Data Science, in Plain English
Four moves are doing the analytical work here. Stated plainly.
First, rational prior. Before looking at 2026 data, start with the base rate from the last fifteen years of oceanography. That prior was already pointing toward a weakening, fragile AMOC. Caesar 2021 was not an outlier. It was a consolidation.
Second, update on new evidence. Each new peer-reviewed paper, each new season of RAPID data, each new model run is a likelihood ratio. The updates since 2021 have, on net, moved the posterior toward higher collapse risk within the 21st century.
Third, watch for critical-slowing-down signatures. Complex systems that approach a tipping point tend to show rising variance and rising autocorrelation in their fluctuations before they flip. Ditlevsen 2023 reports exactly that fingerprint in North Atlantic sea surface temperature. This is one of the strongest empirical reasons to take the tail risk seriously.
Fourth, cost-benefit asymmetry. The downside of underestimating a tipping risk is civilization-scale. The downside of overpreparing is, in almost every scenario, modest: better insulation, cleaner grids, more resilient agriculture, fewer wars over water. A rational actor weighs those two downsides and acts accordingly. This is not pessimism. It is arithmetic.
IV. What a Slowing AMOC Actually Does
The physical consequences are not abstract. They are already partially observable and well-characterized in the literature.
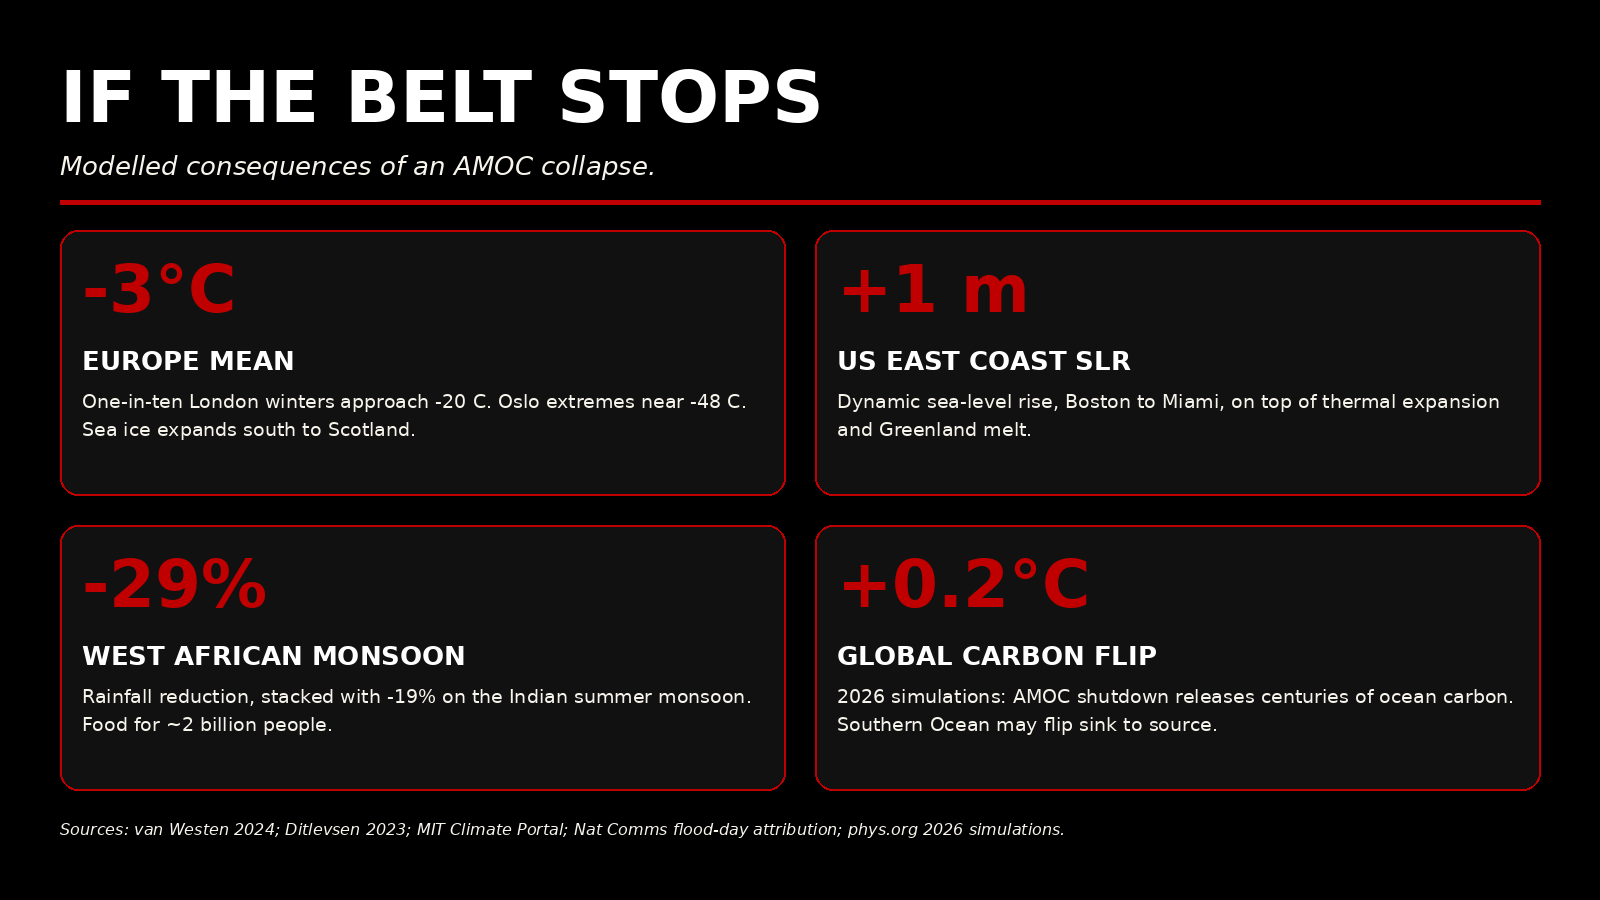
Europe loses a portion of the heat currently delivered to its western coasts. Mean winter temperatures fall in the UK, Ireland, Scandinavia, and parts of continental Europe, even as the planet as a whole continues to warm.
The tropical rain belt, the Intertropical Convergence Zone, shifts south. That movement disrupts the West African and South Asian monsoons, destabilizing food systems for hundreds of millions of people.
Sea level on the US East Coast rises faster than the global mean. A weaker Gulf Stream reduces the sea-surface slope that currently holds water offshore, adding additional inches to coastal flooding in Boston, New York, and Norfolk on top of thermal expansion and ice loss.
Atlantic hurricane behavior changes. Storm tracks, intensities, and seasonal timing all respond to SST gradients that a weakening AMOC reshapes.
Marine ecosystems reorganize. Cod, herring, and plankton communities follow isotherms. Fisheries follow the fish. Coastal economies follow the fisheries.
V. A Modeling Scenario, Held Lightly
Consider a scenario, explicitly a modeling exercise, not a prediction. Assume the AMOC weakens another 20 percent by 2050 without full collapse. In that world, a European January is noticeably colder on average. A Sahel July is noticeably drier. A Norfolk, Virginia, king tide floods three more streets than it did a decade earlier. A cod fishery in Maine quietly relocates north of the Canadian border, and the town that depended on it does not.
None of that requires a Hollywood shutdown. It requires only the continuation of a trend the instruments already see. That is the honest, uncinematic shape of this risk.
VI. The Compassionate Move
A rational, compassionate citizen reading the 2026 literature arrives at a short list.
Take the science seriously without taking it apocalyptically. The AMOC slowdown is real. A near-term full shutdown is not the central estimate. A meaningful further weakening, with serious regional consequences, is the central estimate. Plan for the central estimate. Hedge for the tail.
Decarbonize aggressively. The single largest lever on future AMOC behavior is greenhouse gas emissions, because warming and the resulting freshwater input from Greenland are the primary forcings. Every tenth of a degree avoided buys time for adaptation.
Invest in observation. RAPID-MOCHA is a small, aging program. OSNAP in the subpolar North Atlantic is newer but also modest in scope. The instruments that tell us whether the belt is skipping cost far less than the consequences of not knowing.
Build local resilience. Coastal infrastructure, agricultural diversification, water storage, and grid reliability all hedge the same underlying risk. Communities that invest now will suffer less later. That is not ideology. It is insurance.
Hold the uncertainty honestly. Neither dismissal nor doom is accurate. The honest statement is: the risk is higher than it looked ten years ago, the physics is understood, and the policy responses are available.
VII. What Has Changed Since Our Last Dispatch
In our Super El Niño op-ed, the frame was short-term amplification: a warm Pacific tipping a warm world into a hotter season. The AMOC frame is different. It is the slow, structural rearrangement of the Atlantic heat engine that sets the Northern Hemisphere climate. Super El Niño is weather on top of climate. AMOC weakening is climate underneath climate.
The throughline is the same. The ocean is the single largest climate actor on this planet, and it is being perturbed faster than our infrastructure, our institutions, and our imaginations are updating.
VIII. My Close
The conveyor belt is skipping. Not stopped. Skipping. That distinction matters because it tells us where we are: past the point where denial is rational, short of the point where surrender is rational, squarely inside the window where clear thinking and coordinated action still move the outcome.
Read the RAPID data. Read Caesar. Read Ditlevsen. Read van Westen. Read the 2026 summaries and note the direction of scientific surprise. Then act with the steadiness of a person who has done the math and the kindness of a person who knows what is at stake for everyone downstream.
The ocean has been carrying an enormous load for a long time. The least we can do is stop making the load heavier.
Coop