Everybody Wants to Know About the Winter
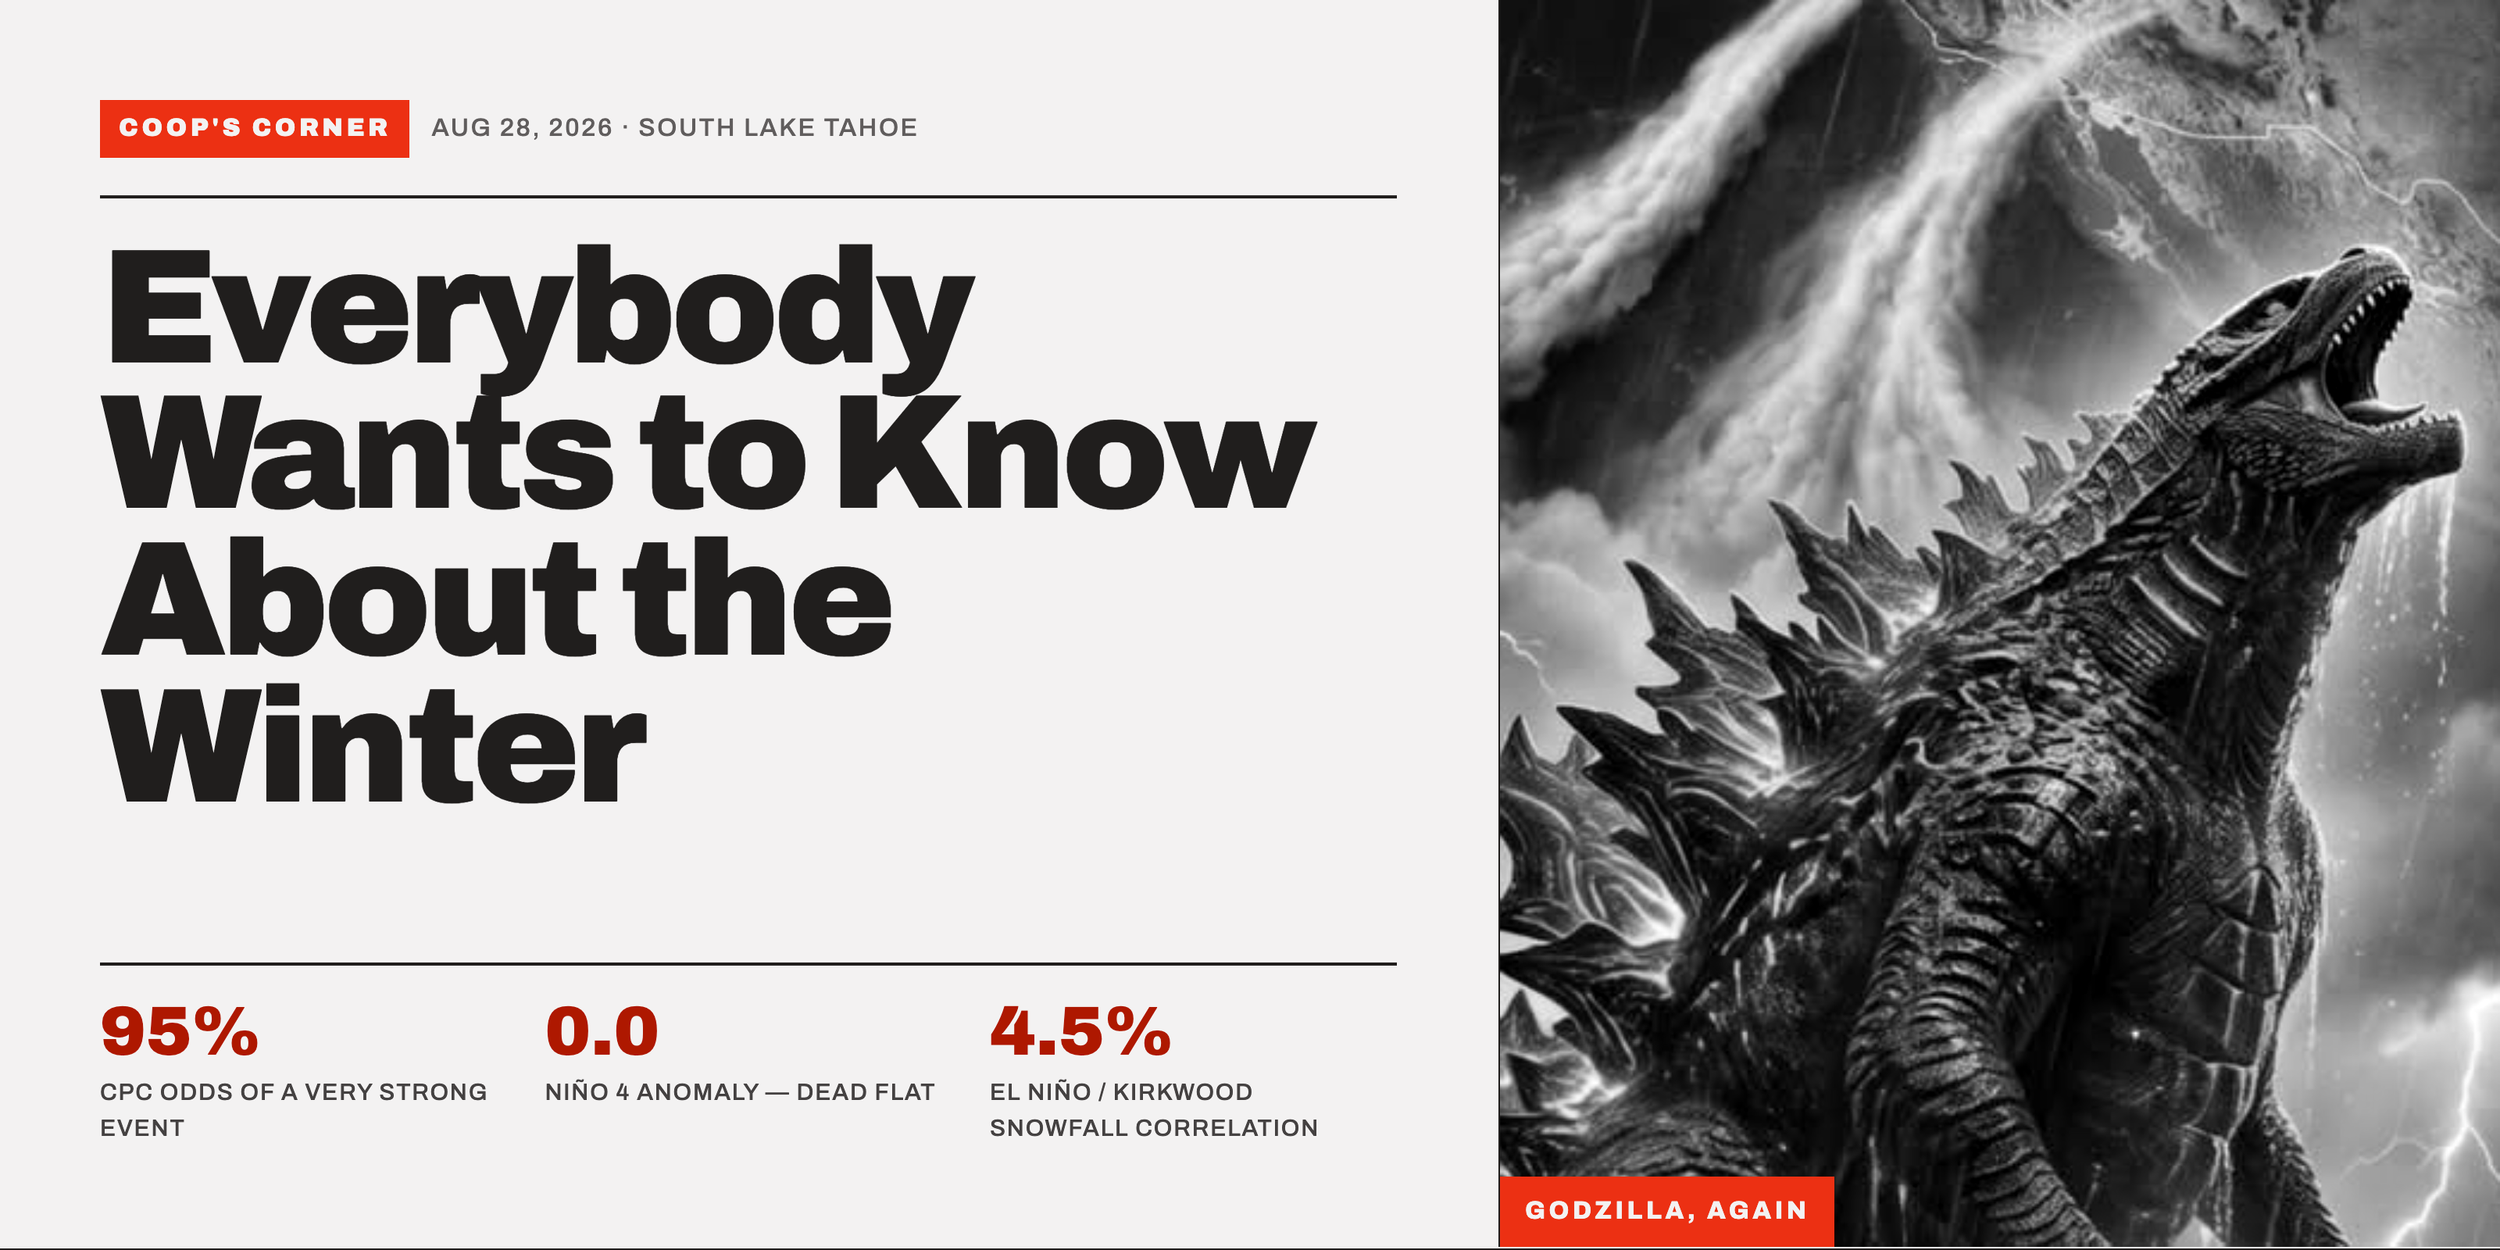
The ocean is loaded. That's not the same thing as snow.
I've been getting the question since about the Fourth of July. Somebody on the dock at Camp Richardson while I'm tying off a boat. Somebody's brother-in-law in Sacramento who saw a headline. A producer down in the Bay Area asking whether she should pencil in the 300" mark and a remote for January 1st. Is this the big one?
This year it's a fair question, because the ocean really is doing something.
Off the coast of Peru, the water is running about six degrees Fahrenheit above where it belongs for late August. Out in the middle of the basin, along the equator about halfway between Indonesia and South America, sits the box called Niño 3.4. That's the patch everybody quotes, because it's the one that talks to our weather most reliably, and it's running a little over three degrees Fahrenheit warm. Japan's meteorological agency measured a July that tied July 1997, the warmest July in a record going back to 1949. The Australians say the heat stored below the surface last month was the most they've measured in any month since they started keeping track in 1979. That heat is the fuel, and it's already in the tank.
The models aren't arguing about it either, which is unusual. The International Research Institute at Columbia runs twenty-six of them, and twenty-five say very strong. NOAA's lab in Princeton runs its model thirty times with slightly different starting conditions, and all thirty land in the same neighborhood. The Climate Prediction Center puts it at 95 percent for a very strong event this fall and gives it a 69 percent shot at being bigger than anything on the books going back to 1950.
One housekeeping note, because it's going to cause fights online all fall. Back in February, the Climate Prediction Center changed the ruler it uses. They now measure that patch of Pacific against the whole tropical belt instead of against a rolling thirty-year average, on the reasoning that the entire tropics have warmed and the old baseline was starting to make every event look bigger than it was. Reasonable change. The practical result is that NOAA published a July figure of 1.4 degrees while Columbia published 2.03 for the same month. Same ocean, different ruler. When you see two numbers that don't match this winter, that's usually why.
Now here's the number nobody's putting on a graphic
There's a fourth measuring box further west, out toward the dateline, called Niño 4. It's sitting at zero. All the heat in this event is stacked on the eastern side of the Pacific and the western end is asleep.
That matters, and it matters for a reason I can point to rather than just assert. El Niños come in two basic builds, east-loaded and center-loaded, and work published last year found that the extreme east-loaded ones don't follow the normal playbook at all. I'll walk through the mechanism further down, because it's the best argument I've got and it deserves more than a sentence. For now: this one is built like the ones that have historically been good to us.
What They're Actually Forecasting
NOAA's August update favors a wet December through March along the California coast, better than even odds, and that's the strongest signal they've put out for this state all year. The snow forecasters agree, with the best signal in the Central Sierra, a slow December, and a loaded January through March.
I don't dispute any of it. Now notice what they're forecasting. Water. Not snow.
That gap is the whole column, so let me show you how wide it gets.
I've been here since 92, and the thing those outlooks can't tell you is whether the water shows up cold. Go look at what El Niño has actually delivered at our resorts over the decades, and the relationship almost disappears. Tony Crocker has spent decades keeping the cleanest snowfall records in the West, and measured month to month, the correlation between El Niño strength and snowfall at Heavenly runs about 8%. Alpine Meadows, 6%. Kirkwood, where I spend most of my winter, 4.5. Palisades up top, 3.5, and down at the 6,200-foot plot, 2.0.
If you don't work with correlations, here's the scale: if El Niño told you nothing whatsoever about our snowfall, the number would be zero, and if it told you everything, it would be a hundred. We're down around four. Crocker's own read of his data is the one I'd put on a slide: for Kirkwood, Palisades and Alpine, the correlations are low and not statistically significant. Two of the strongest El Niños on record, 1991-92 and 1986-87, were drought years in this basin.
A second, completely unrelated dataset says the same thing. Of the eight costliest flood seasons in California since 1950, three were El Niño years. El Niño makes up roughly a quarter to a third of all winters, so three out of eight is about what you'd get drawing straws. The 1997 New Year's flood, the one everybody around here still measures things against, happened in a plain neutral year.
Now let me turn that same number around on myself, because it cuts both ways and I'd be cheating if I only swung it one direction.
A correlation near zero doesn't mean this winter will disappoint. It means the ocean isn't telling you which way this goes. If El Niño is weak evidence for a monster winter, it's exactly as weak as evidence for a bust. Anybody using this event to promise you 700 inches is guessing, and so is anybody using 2015-16 to promise you a repeat letdown. I'll cop to my own thumb on the scale here: I stood on bare ground last March, and it colored how I walk into this fall. That's a feeling, not a forecast, and you should discount it accordingly.
Researchers at Scripps published work in 2024 that explains why the ocean stays quiet on the question. El Niño changes how wet a storm is once it shows up. It doesn't much change how often the storms show up. The Pacific loads the gun. The atmosphere still decides whether to pull the trigger, and it makes that call week to week in January, not in a model run in August.
Three Doors
So if the ocean can't tell us, what does? The freezing level, and behind it, where the cold air comes from.
Every storm that lines up on us this winter sorts into one of three outcomes, and the sorting happens on temperature, not on moisture.
Get cold air riding in behind the moisture, usually digging down out of the Gulf of Alaska, and the snow levels drop below lake level, and then #ColdSmokePow. We don't get that as often as any of us would like.
Get marginal cold against warm moisture, and you get #GorillaSnot. Heavy and wet, sets up like concrete behind the snowcat. In October and November I'll take every inch of it you can give me, because that's what builds a base that survives to April. In February it's a different animal. It loads the starting zones fast, it's punishing to ski, and it's the front end of rain-on-snow and the avalanche cycle that follows.
And if the cold never shows up at all, which a warm jet aimed at us from the southwest is perfectly capable of arranging, you get snain, that miserable half-and-half that soaks you to the bone, and then straight rain to 10,000 feet.
Last winter was door number three. California got close to normal precipitation. Every drop of it arrived. On April 1st, and yes, I appreciate the joke, the statewide snowpack measured 18% of average, second worst on record, and the Northern Sierra came in at 6%. The water showed up right on schedule, fell as rain, ran down the creeks, and left the range bare in March. I stood in it. So did you. One season doesn't prove a trend, and I'd say the same to anybody waving 2010-11 at me. But it's a clean picture of what door three costs.
It cost more than a ski season. We're walking into this fall in decent shape on paper, with only 7% of California in drought and the big reservoirs at or above where they should be. Nevada is the problem, with 88% of that state in drought. Down on the Colorado, Powell and Mead together are holding less water than at any point since before Powell started filling in 1963, which has already triggered delivery cuts of about 10% for California and roughly 17% for Nevada in 2027-28. Rain that runs straight to the ocean doesn't help any of that. Snow that sits until June does.
The hook-up: Which brings me to the Gulf of Alaska, and the one piece of this I'd tattoo on the inside of your eyelids if you'd let me.
A Gulf low is a deep upper-level low that sets up out in the Gulf of Alaska and turns counterclockwise, dragging polar air down its back side. It's the cold factory for this entire coast. It doesn't make our snow. It makes our snow possible.
Picture the two pieces separately. The subtropical jet comes at us from the southwest loaded with tropical water, and that's the firehose, the thing you've heard called a Pineapple Express, Atmospheric river (AR). The Gulf low sits up to the northwest holding all the cold.
When they hook up, when that low digs far enough south and east that the firehose runs into its cold flank right as the whole mess slams the crest, you get the winters that get names. Cold air aloft, tropical moisture underneath it, and 11,000 feet of Sierra granite forcing all of it vertical. That's five feet in a day. That's ten feet before the cycle lets go. That's when Caltrans and CHP walk I80 and Hwy50 up the chain-control ladder, R1 to R2 to R3, and then give up and close them, when SR88 over Carson Pass into Kirkwood goes down first and stays down longest the way it always does, when NHP runs the same ladder on Mt. Rose and Kingsbury, and when my phone starts going off at two in the morning.
When they don't hook up, the firehose still shows up. It just shows up alone, and it shows up warm. Snow levels at 8,000 feet, then 9,000, then 10,000. Fifteen inches of liquid on the crest with nothing cold enough to freeze it. Rain/Snain from Echo Summit to Donner, rain falling on whatever base we built in November, and all of it in the Truckee and the American inside of two days.
Same water. Same storm total. Two completely different winters.
I used to describe those two pieces as independent systems that don't answer to each other. That was sloppy. They talk, and in a garden-variety El Niño the conversation goes badly for us. Tropical heating builds a ridge over northwestern North America, and that ridge parks right on top of the country where our cold air gets manufactured. The warm water buys the firehose and then blocks delivery of the cold. That's the machinery behind a lot of disappointing El Niño winters up here, and anybody selling you a wet outlook without mentioning it is skipping the hard part.
Which is why the eastern loading is worth more than a shrug. Work published in 2024 on the extreme events, the 1982-83, 1997-98, and 2015-16 classes, found those winters break the normal pattern. When the warming is big enough and far enough east, the whole setup slides roughly 20 to 30 degrees east with it. The ridge shifts off the cold source and out toward the Atlantic. The North Pacific low slides east until it's sitting against the North American coast, much closer to the hook position than where it normally sits. That same work puts the odds of a wetter-than-normal Western US around 74%.
Against a coin flip, 74% is the largest number in this column, and it's larger than anything on the pessimistic side of the ledger. So let me square it with the correlation figures, because they look like they're arguing.
They're measuring two different things. The 4% correlation is pooled across every El Niño of every size and shape, and it's telling you that El Niño strength on its own doesn't predict our snowfall. The 74% is about a specific subset, the extreme east-loaded events, and it's telling you about water, not snow. Both can be true. What it adds up to is that the odds of a wet winter are legitimately good, and the odds of a cold one are still an open question.
2015-16 was in that same extreme sample, and we all remember how that turned out.
The Numbers, By Elevation
Here's the table I wish somebody had handed me when I moved up here in 1992. These are Crocker's figures off bestsnow.net, not resort marketing copy, which is why several run well under the number you'll find on a resort website. The middle column is the average. The next one is the typical swing, how far a normal season lands above or below that average.
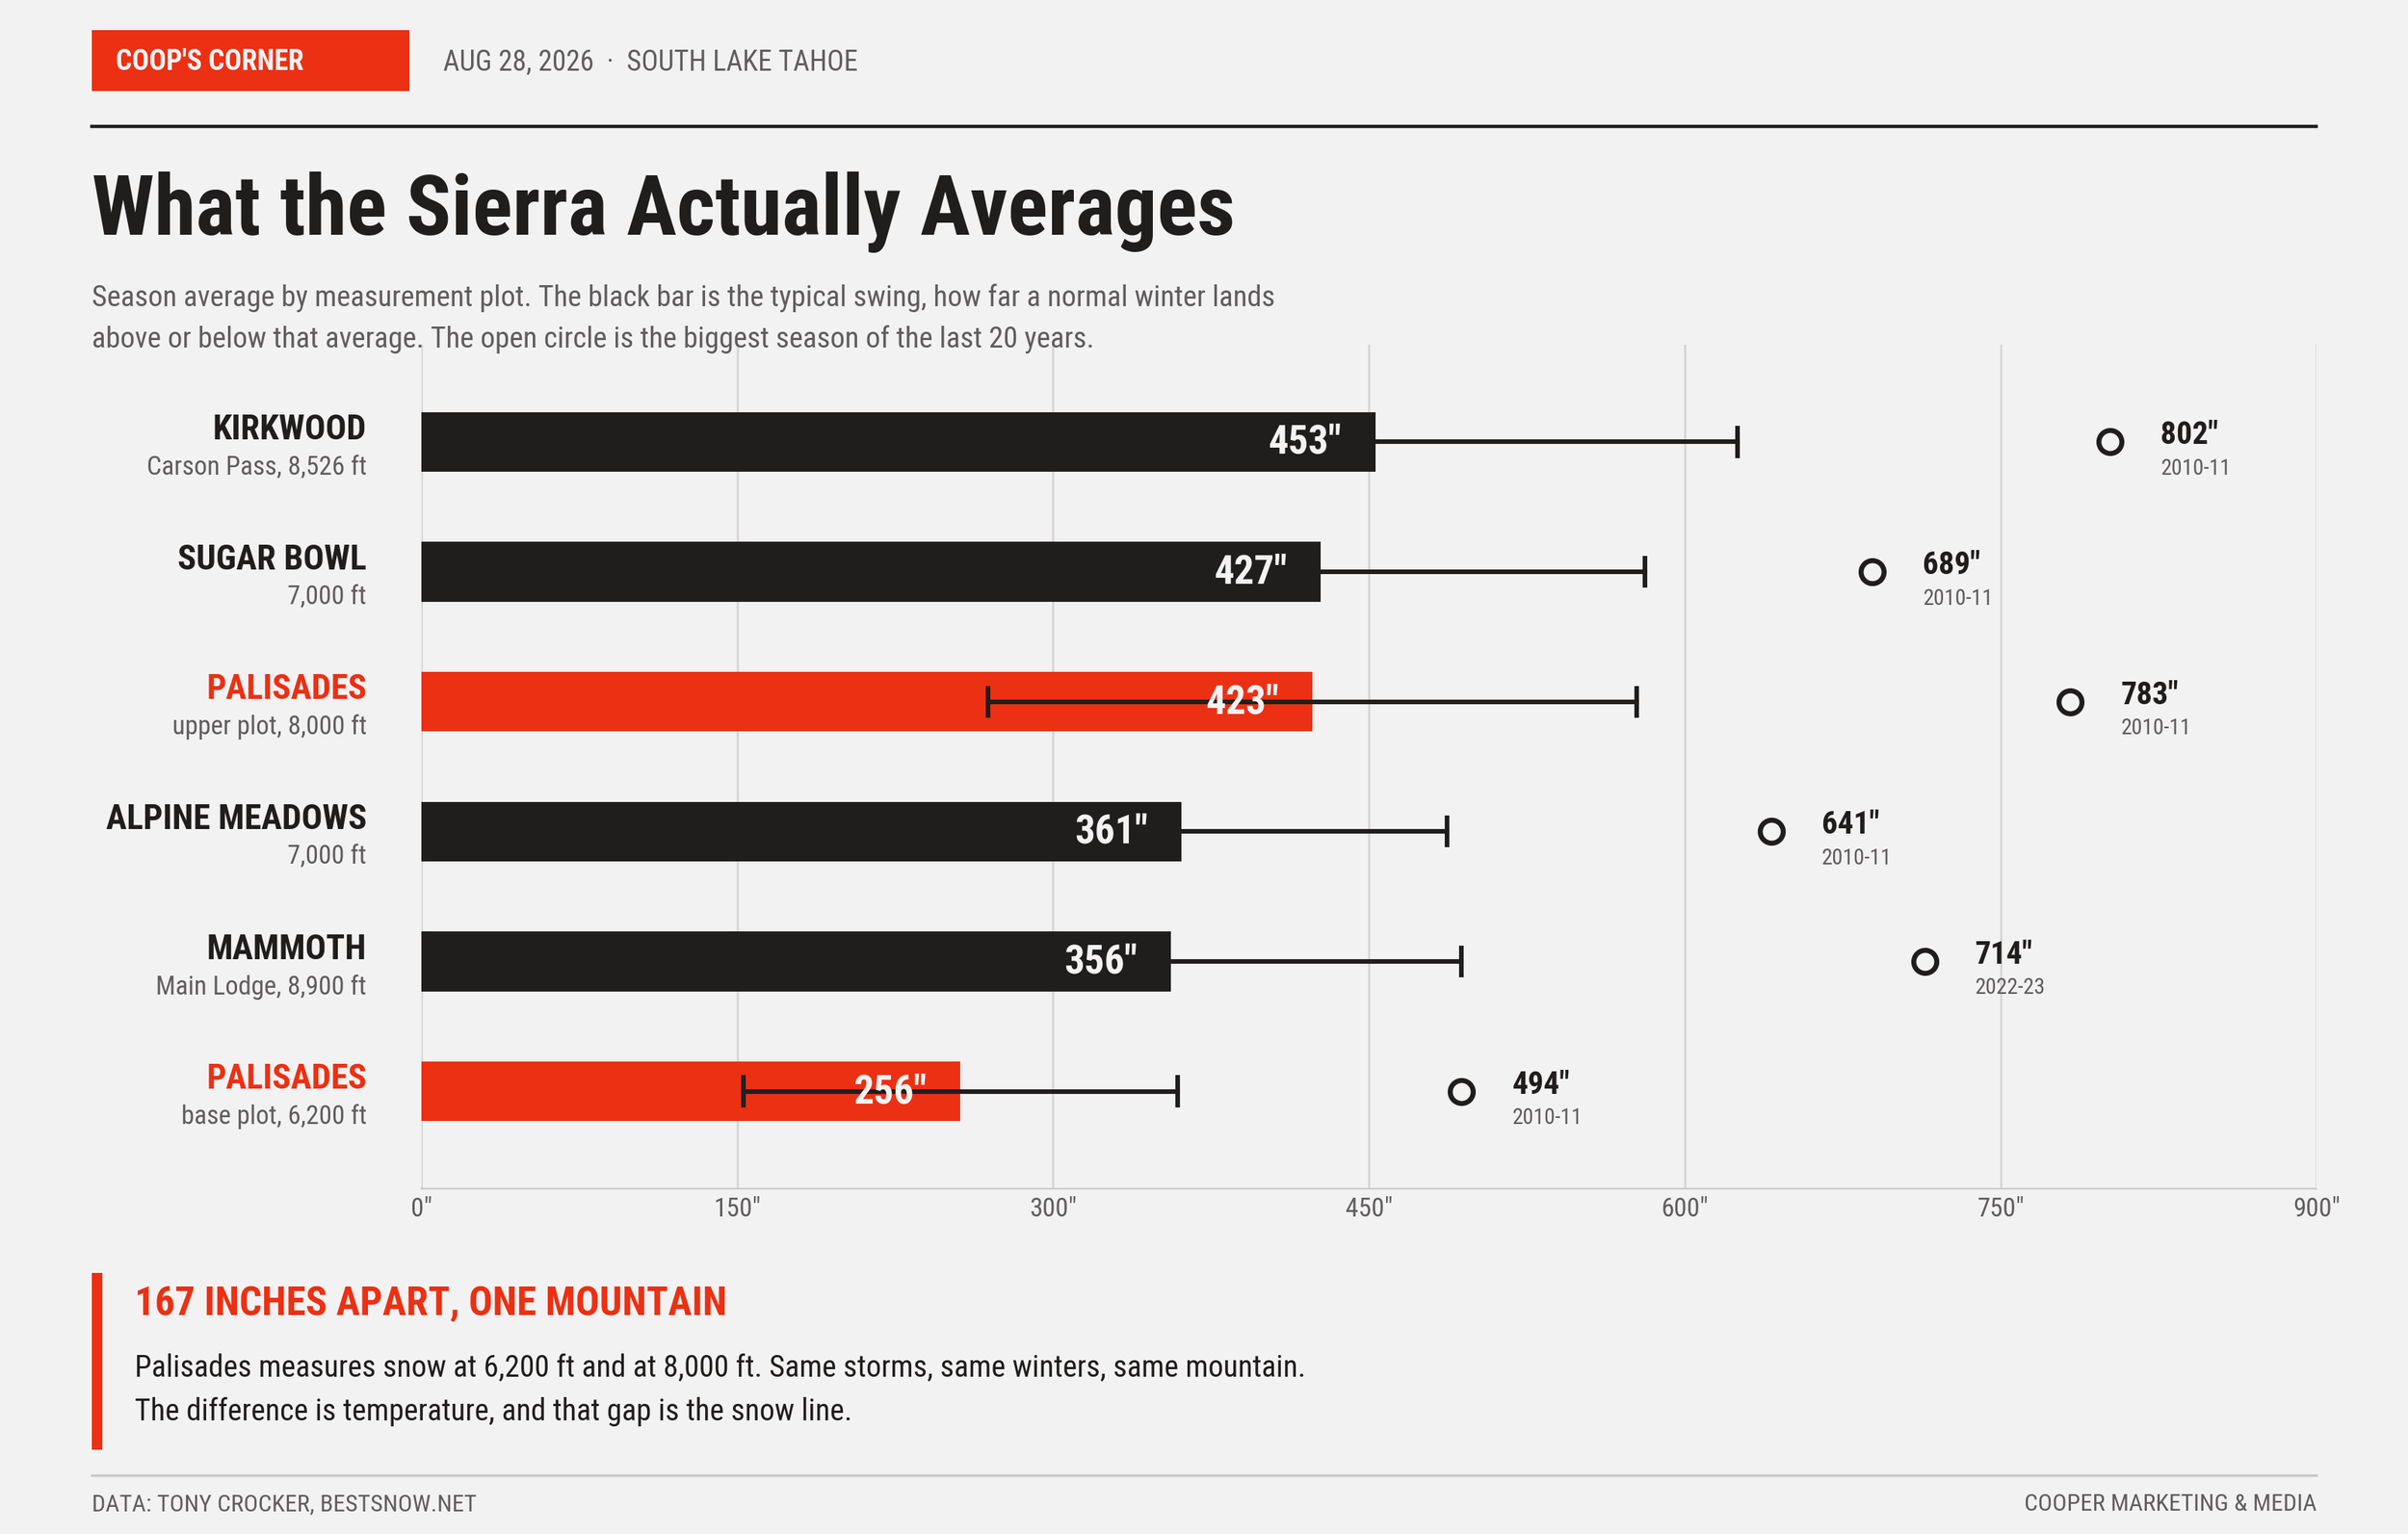
The Palisades rows are the whole argument.
Same resort. Same storms. Same winter, every winter. The plot at 6,200 feet averages 256 inches a season. The plot at 8,000 feet on the same mountain averages 423. That's 167 inches of difference inside one ski area, and almost none of it is a difference in how much water showed up. It's a difference in temperature. That gap is the snow line, drawn permanently across terrain you've skied a hundred times.
Then understand what an 8,000 or 9,000 foot snow line does to the rest of the range, because the pain doesn't get distributed evenly. Dodge Ridge runs from 6,600 feet at the base to 8,200 at the summit. Put the snow line at 9,000 and the whole mountain is underneath it, top to bottom, every acre they sell a ticket to. The same math comes for every low-elevation operation on this side of the crest. A warm winter doesn't trim a little off the bottom of the season. It cuts the range in half horizontally and hands everything under the line to the creeks.
The swing column should cool the hype to room temperature. Kirkwood averages 453 inches and swings 172 either side of it. Sugar Bowl, 427 and 154. An ordinary Sierra winter routinely lands 170 inches above or below normal for reasons that have nothing to do with the tropical Pacific. Set that beside a correlation of four, and you can see how much of our winter El Niño actually accounts for. Almost none of it.
And notice that last column. Several resorts sold 2022-23 as their snowiest season on record. Measured Crocker's way, at a consistent plot, 2010-11 beat it at both Palisades and Kirkwood, and it isn't close. Mammoth is the one where 2022-23 really was the bigger of the two. The rest was a press release.
Guan and his coauthors put numbers on the temperature question that I keep taped up. Looking at the firehose storms that hit the Sierra, the ones that built real snowpack ran about four degrees Celsius below freezing at the surface. The ones that did nothing, or did damage, ran about half a degree above it. Four and a half degrees, total, between the best week of your life and a flood warning with a bare mountain behind it.
Four and a half degrees. That's the whole ballgame, and no model on earth can see it from August.
The Hype Train Has Left the Station
You're going to see the phrase Super El Niño more times than you'll be able to stand between now and Thanksgiving. On your feed, in your inbox, on a graphic with a lightning bolt, a countdown clock and three exclamation points. In some corners it's already been upgraded to Godzilla El Niño, a term a NASA scientist named Bill Patzert hung on the Pacific back in 2015, the fall before a winter that finished right around average up here. The word came back before the winter did.
The phrase isn't exactly wrong. It's just doing a job that has very little to do with forecasting.
I'm not going to tell you to ignore it, because hope is fuel and I'm not made of stone. The #StokeLevel around here is up a-lil, @11.1. The ocean is real, the eastern-loaded shape of this thing tilts the odds our way, and I'm looking forward to this winter more than I have to any of the last four.
Rule #1: #NoOverStoking. You get what the data says, including the boring parts and the disappointing parts, and you get a straight "I do not know" when I do not know. Anybody handing you a seasonal snowfall number in August is selling, not forecasting, and that goes for a number in either direction.
Rule #2: Rain, snain, or snow, we need the water. All of it, every inch, however it wants to arrive. I'd rather have a wet winter that skis badly than a dry one that skis badly. The reservoirs don't care what phase it shows up in, and neither should we.
Rule #3: #Respect. Nobody here is in charge of the weather, and that includes me. I read the guidance and wigi-board, and I’ll let you know what I see and pin a #StokeLevel to it.
So, hold me to Rule #1; here's what would change my mind. If we get to the middle of December and the North Pacific low is sitting in its usual spot instead of shifting east, and an HP ridge is planted over Alaska and British Columbia, then this is a Southern California winter, and I'll say so right here, on the chair, and on air. Watch that, not the ocean temperature.
One last thing, because I don't want any of the above ☝️ read as me telling you to sit this winter out.
Buy the pass, book the trip. Pick up the new sticks, the new deck, the boots, the grippers. It's going to snow. Winter's coming back to a mountain near you, the way it always does. Just don't buy the hype.
#MotherNature is going to deliver what she delivers. #KingNeptune is going to serve up the water. The JET decides where it goes and how warm it is when it gets here. Üllr handles the rest, and he still hasn't returned my calls.
Get'yr gear prepped and ready to go. Take the #GorillaSnot when it comes, because we'll need the base. Then watch the freezing level. Four and a half degrees is the number that decides whether any of this counts, and it's the only one worth your attention this winter.
And when it's here, put down the methadone metronome, as Üllr will guide us to the frothy #ColdSmoke once again, same as he always does. We will ride, chasing 100 days on-snow and in-deep. #StokedLevelPinned, Fired up, and ready to ride.
Coop
RS#69 | Semper Paratus